Los Angeles American Indian and Alaska Native Project1
Technical Memo 5:
AIAN Underrepresentation in the ACS
Jonathan Ong and Paul Ong
November 19, 2012
This technical memo addresses an underestimation of American Indians and Alaska Natives (AIAN) in the American Community Survey (ACS) relative to the number reported in the 2010 decennial enumeration. This problem is due largely to a severe underestimation of the single-race AIAN population, which is comprised of those who self-identify as being AIAN alone.
The decennial count is the official count performed by the U.S. Census Bureau and is conducted to get as complete a count of the population of the United States as feasible. The enumeration is conducted in accordance to Article I, Section 2 of the U.S. Constitution, and the data are used for reapportionment (the allocation of Congressional seats among states) and redistricting (the drawing of electoral districts). Race data are collected in part to help enforce voting rights for minorities (U.S. Bureau of the Census, n.d). The enumeration collects information on the age, race, ethnicity, gender, household size, and household type. Although the decennial count suffers from an undercount of some disadvantaged groups (U.S. Bureau of the Census, 2012), the unadjusted numbers are used by the federal government as official figures. For the purpose of this memo, the counts are taken as the baseline.
The ACS has replaced the census long-form survey, which was conducted at the same time of the decennial enumeration. The ACS is conducted continuously and reported annually, and collects demographic, socioeconomic, and housing data. The results are widely used by private, public, and nonprofit agencies and organizations. Any serious flaws in ACS statistics can have serious implications in identifying problems, shaping policies, and allocating resources. Unlike the decennial enumeration, the ACS is based on a small sample that is roughly 2.5% of all households in the United States each year. The sample is weighted to generate estimates of the total population. The accuracy of those estimates depends on the representativeness of the sample and the precision of the weights. Moreover, the ACS is subject to sampling error, and the "luck of the draw" may randomly generate statistical discrepancies.
For this memo, we examine the 2009–11 ACS in order to have a significant number of AIANs in the ACS sample. Both the decennial enumeration and the ACS are based on self-reported racial identity; consequently, a respondent can report being AIAN alone or AIAN in combination with another racial category. AIANs are classified three ways: (1) an inclusive count of those who are AIAN alone or in combination; (2) a single-race or alone count of those who selected only the AIAN racial category; and (3) a mixed-race or in-combination count of those who self-reported being AIAN and some other race.
As seen in Table 1, the ACS estimates for the total population closely mirror the total population in the 2010 enumeration, which is not surprising because the weights are based on annual population estimations, which are benchmarked to the 2010 Decennial Enumeration. The 2009–11 ACS estimate of the total population count is within a fraction of a percentage point of the 2010 decennial census. The difference may be due to nonlinear growth between 2009 and 2011 and the fact that the decennial enumeration was conducted in April of 2010 rather than the middle of 2010.
|
Table 1: 2010 Enumeration Counts and ACS Estimates |
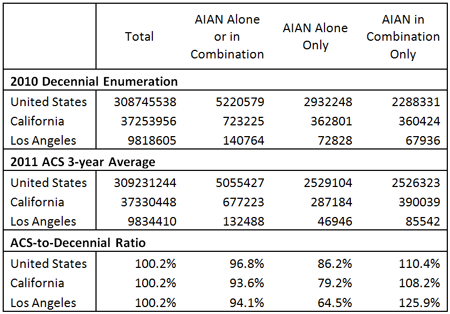 |
While there is virtually no discrepancy for the total population, the inclusive AIAN estimates are noticeably lower, as reported in Table 1. For the inclusive AIAN counts (alone and in combination), the ACS national estimate is about 3% lower than the 2010 counts. The discrepancy is greater for California and Los Angeles2 (about 4% lower). The difference is due entirely to an underestimation of AIANs alone. At the national level, the ACS estimates are less than seven-eighths of the 2010 counts. This is partially offset by a higher estimate by the ACS of AIANs in combination, which is about a tenth greater than the decennial numbers. This pattern of over- and underestimation is repeated for California. There are only four AIANs alone in the ACS for every five in the 2010 census, partially offset by higher figures in the ACS for AIANs in combination. The problem is most severe for Los Angeles, with the 2009–11 ACS reporting less than two-thirds of the AIAN alone than the 2010 census.3
The discrepancies between ACS and the decennial counts cannot be explained by random sampling error. The difference is much larger than the margin of error for the ACS. For example, the margin of error for AIAN alone in Los Angeles County is +/-2,603; however, the observed discrepancy is nearly 26,000 fewer AIAN alone in the ACS tabulations than in the 2010 count, a difference of nearly tenfold the margin of error. This is not unique to Los Angeles alone and thus appears to be a systemic problem. In California the margin of error given is +/-7,627, but the difference is greater than 75,000, resulting again in a nearly tenfold difference. On the national level the margin of error given is +/-17,900, but the difference is about 403,000, which is more than a twentyfold difference.There are two potential sources for the underestimation in the ACS: under sampling due to a difficulty in reaching AIANs and incorrect weights used to convert the sample into estimates. One possible way to determine the relative importance of the two possible sources is to analyze the 2009–11 ACS Public Use Micro-Sample (PUMS) data. PUMS is an individual-level subsample of ACS data, covering approximately 1% of the population. Tabulating the ACS PUMS produces very similar population estimates as the web-published ACS tables. Table 2 reports the weighted estimates of the AIAN populations as a proportion of the total population, and most of the percentages are within 0.01 points. Because of the similarity, analyzing ACS PUMS can provide reasonable insights into the source of the underestimation problem.
|
Table 2: ACS Public and PUMS Estimates of AIAN as % of Total Population |
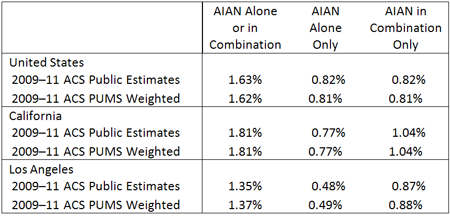 |
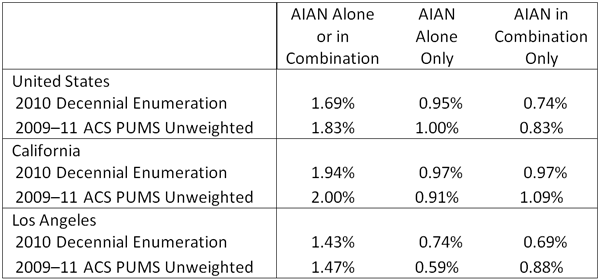
Table 3 reports AIANs as a percent of the unweighted PUMS sample. The three-year PUMS sample contains all AIANs (alone and in combination), roughly proportionate to the AIAN share of the decennial counts and in fact slightly higher. Over sampling is also noticeable for AIANs in combination at all three geographic levels. AIANs alone, however, are under sampled in California and more so for Los Angeles. In this region, they made up more than 0.7% of people counted in the 2010 decennial census but less than 0.6% of the ACS sample. While sampling variation contributes to the inaccurate ACS estimates of the AIAN populations, systematic sampling error cannot explain the entire discrepancy.
|
Table 3: AIANs as a Percent of 2010 Count and Unweighted ACS Sample |
 |
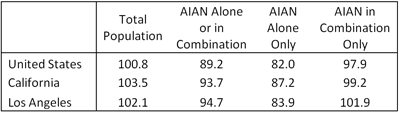
The problem is compounded by systematic differences in the weights used to translate the ACS sample into population estimates. This can be seen in table 4. The mean weight across all three years is slightly over 100, corresponding to the approximate 1% sampling, but the mean weight for AIAN alone is only 84, 87, and 82 in Los Angeles, California, and the nation respectively. This is reasonable when a group is over sampled, such as the case for AIANs nationally, although the weights are still too low. In Los Angeles, the lower AIAN-alone weights interact with under sampling to produce the severe underestimate of AIANs alone in the ACS.
|
Table 4: Mean weights in 2009–11 weights |
 |
The above findings have potentially profound implications for our understanding of the AIAN population, the problems they face, and the policies based on government statistics. According to the U.S. Bureau of the Census:
The American Community Survey (ACS) is an ongoing survey that provides data every year—giving communities the current information they need to plan investments and services. Information from the survey generates data that help determine how more than $400 billion in federal and state funds are distributed each year.
http://www.census.gov/acs/www/about_the_survey/resources/congress.php
Inaccurate reporting of the size of the AIAN population can place this group at a disadvantage, and this is particularly true for AIANs alone. This can lead to an undercount of the number of AIANs facing various employment, educational, and other challenges. The analysis indicates that both sampling and weighting can contribute to the discrepancy between ACS and the decennial count. The relative roles of these two factors vary geographically.4
Based on the findings, we recommend that the Bureau of the Census reweigh the data to improve the population estimates. There are, however, other issues, such as the severe under sampling of AIANs alone in Los Angeles. This will require additional research to identify the cause of this problem, research that should be supported by the Bureau of the Census in consultation with AIAN experts.
References
Lee, S., Satter, D., and Ponce, N.A. "Effect of Race and Ethnicity Classification on Survey Estimates: Anomaly of the Weighted Totals of the American Indians and Alaska Natives." American Indian and Alaska Native Mental Health Research, 16.3 (2009), 1–15.
"Census Bureau Releases Estimates of Undercount and Overcount in the 2010 Census." Newsroom: 2010 Census: Census Bureau Releases Estimates of Undercount and Overcount in the 2010 Census. U.S. Bureau of the Census, 22 May 2012. Web. 24 Aug. 2012. http://www.census.gov/newsroom/releases/archives/2010_census/cb12-95.html.
"Census in the Constitution." Census in the Constitution—2010 Census. U.S. Bureau of the Census, n.d. Web. 24 Aug. 2012. http://2010.census.gov/2010census/about/constitutional.php.
1 This technical memo is a product of a collaborative effort by UCLA American Indian Studies Center and the Los Angeles Urban Indian Roundtable. We would like to thank reviewers for their input, feedback, and comments. The authors are solely responsible for the contents of this report.
2 Others have also commented on the importance of weight in estimating AIANs (Lee, Satter, Ponce, 2009).
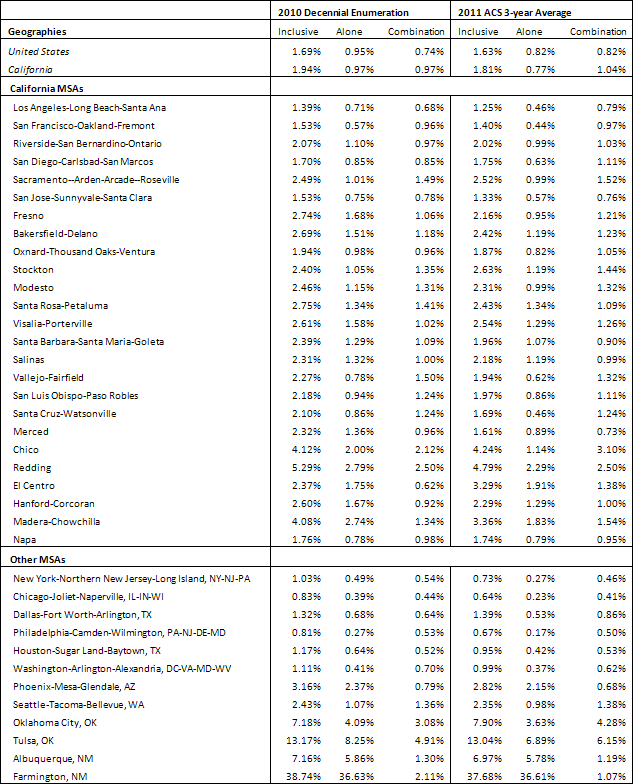
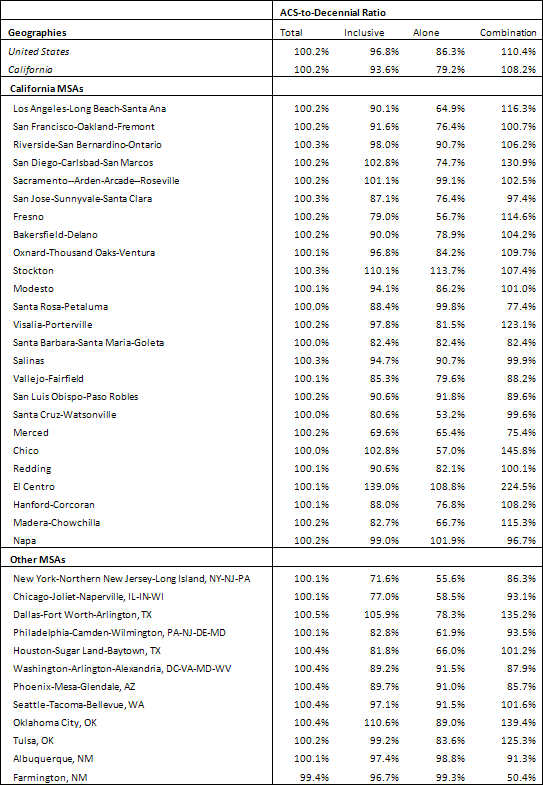
3 We also find the same pattern of underestimation and overestimation for the vast majority of metropolitan areas with large AIAN populations. See appendix.
Appendix
|
American Indian Studies Center 3220 Campbell Hall, Box 951548 Los Angeles, CA 90095-1548 |
Phone: (310) 825-7315 Fax: (310) 206-7060 Email: aisc@ucla.edu |
AISConnect →


|
|