Los Angeles American Indian and Alaska Native Project1
Technical Memo 1:
Population Change & Components of Change
Jonathan Ong and Paul Ong
November 16, 2012
Part 1: Introduction, Methodology and Data Sources
This brief examines the AIAN (American Indian and Alaskan Native) population between 2000 and 2010 in Los Angeles and estimates the components of change. The total at any point in time provides information on the size of the AIAN population in Los Angeles County, and it is useful to compare that number to the total population in the region and to the AIAN population at other geographic levels (e.g., for California and the nation). Comparison over time provides a sense of the rate of growth or decline. We start in this introduction with a discussion of basic concepts and data sources.
The analysis in this report is based on a standard demographic approach to define the population at one point in time as the sum of the population in a prior time plus other factors (Cheney, 2009). The following formula is used. The population at time "t" [P(t)] is the sum of the base population in the previous time period "t-1" [P(t-1)] plus births B, minus deaths (D), plus in-migration (IM) and minus out-migration (OM) during the time period.
When in- and out-migrations are not directly observed, net migration (NM) can be used, which is equal to in-migration minus out-migration; the formula can be rewritten as:
As many have noted, racial identity is socially constructed and subjectively interpreted; consequently, it is possible that individuals can (and do) shift self-perceived identity between two points in time. This has implications for information that relies on self-reported racial identity, such as data collected by the U.S. Bureau of the Census. Passel's analysis of earlier census data indicates that growth in the AIAN population could not be from demographic factors alone, but also from self-identification (Passel, 1997). This means that for a subpopulation defined by race, the above formula should include two additional components, one that includes those who change their self-reported identity into the group's racial category (IR) and the other component includes people who change their self-reported identity away from the group's racial category (OR).
An alternative specification uses net change in shifting racial identity shift (NR), the sum of IR minus OR, which is written as:
Ideally, one would like to have data for each of the components of change broken down by age and for small time intervals. However, such data are not usually available, particularly for small subpopulations. In some cases, there is no information for some of the components, so they have to be estimated from available information.
The main source of data for this memo is from the decennial enumeration. The latter is conducted every decade to get as complete a count of the people as feasible. The enumeration is conducted in accordance to Article I, Section 2 of the U.S. Constitution, and the data are used for reapportionment (the allocation of congressional seats among states) and redistricting (the drawing of electoral districts) (U.S. Bureau of the Census, n.d.a). Race data are collected in part to help enforce voting rights for minorities. The enumeration collects information on the age, race, ethnicity, gender, household size, and household type. Figure 1 is the form used in 2010 (U.S. Bureau of the Census, n.d.b). It is important to note that there was a significant change in how race data were collected starting in the 2000 decennial census. In prior enumerations, respondents were instructed to check only one racial category. Since 2000, respondents have been allowed to check one or more categories. This disparate method in data collection makes racial statistics from the two periods incompatible.
For American Indians and Alaskan Natives, there is an option to self-report the name of one's enrolled or principal tribe. The Alaskan Native component includes Aleuts and Eskimos, and the AIAN count includes a relatively small number who self-report as Latin American Indians. This latter term is somewhat ambiguous because it could include those who are of mixed ethnicity, such as those who are of both Mexican and American Indian descent, and those who are from indigenous populations in a Latin American country. Â This report uses three different AIAN counts: (1) AIAN alone (only the AIAN category was chosen); (2) AIAN in combination (the AIAN category plus one or more other category); and (3) AIAN alone and in combination (the sum of the first two categories). There are alternative terminologies for these three categories: single-race AIAN refers to AIAN alone; multi-race AIAN refers to AIAN in combination; and inclusive AIAN refers to AIAN alone and in combination. The size of the multi-race AIAN subpopulation relative to inclusive AIAN count is large, accounting for 43.8% at the national level, a rate second only to Native Hawaiians and Other Pacific Islanders. The U.S. Bureau of the Census publishes more statistics for the AIAN-alone population than for the other definitions of AIANs (multiracial and inclusive); consequently, the analysis is only partial in some areas. Finally, it should be noted that it is impossible to count every AIAN in the decennial census because some are extremely difficult to reach and some are reluctant to participate. In 2000 the census estimates that there was a
4.9% undercount of AIAN on reservations, compared to a 0.9% overcount in 2000. However, the net error was not statistically significantly different from zero in the case of AIANs not living on reservations (U.S. Bureau of the Census, 2012).
We supplement the decennial counts with information two other sources. The first includes specialized tabulations from the 2000 public use micro sample (PUMS) and the 2010 American Community Survey (ACS) PUMS. A PUMS data set contains micro-level (individual level) observations of persons and households, and its main advantage is the ability it provides analysts to customize tabulations for statistics not published by the U.S. Bureau of the Census. The 2000 PUMS is based on the long-form data collected from one-in-six households during the decennial census and includes detailed demographic, socioeconomic, and housing information. The ACS has replaced the decennial survey with a continuous survey that is released on an annual basis. The main advantage of the ACS is more timely information, but the sample size is considerably smaller, roughly 2.5% per year. While PUMS allows for flexibility, it contains only a subset of the respondents, either 1% or 5% of the universe; consequently, estimates are subject to a relatively larger standard of errors than in the published statistics. The second supplementary data source comes from vital statistics. This includes births and deaths, which can be used directly or indirectly as normalized fertility and mortality rates. There are two limitations. One, coverage is inconsistent. In particular, vital statistics are not consistently available at all desired geographic levels. Two, the racial classifications are not necessarily consistent with census data; therefore, comparisons of the two data sources should be viewed with caution.
The rest of the report is organized into five parts. The introduction discusses basic concepts and data sources. Part 2 examines overall population change between the two decades. While the numbers of AIANs grew in this region, the growth was concentrated among those who were multiracial, and the AIAN growth rates in Los Angeles were lower than for AIANs in the state and nation. Part 3 compares the age distribution of AIANs, and the results indicate a decline among youths. Part 4 examines other evidence (births and school enrollment) related to the decline in the youth population. The available information is consistent with the observed pattern in the census, but also indicates that the pattern may be reversing. Part 5 estimates death and net migration, and finds that there appears to be a noticeable net out-migration from Los Angeles for single-race AIANs. Unfortunately, it is not possible to examine the patterns for multiracial and inclusive AIAN populations. Part 6 explores the relative size of shifting racial identity at the national level, and finds evidence to support the assertion that there is a net shift to a higher rate of self-reporting of AIAN identity.
| Figure 1 |
 |
Part 2: Population Size in 2000 and 2010
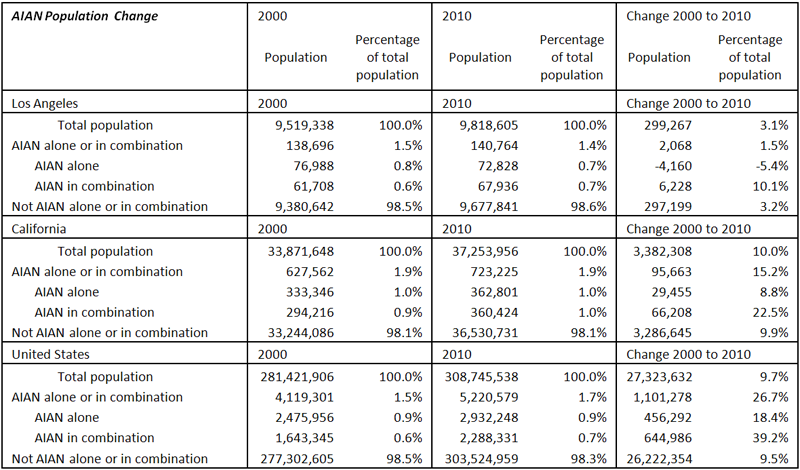
We start by examining the total AIAN population counts in the two periods of interest, P(t) and P(t-1), where t=2010 and t-1=2000. Depending on which AIAN count is used, the decennial data presents different pictures for Los Angeles. As shown in table 1, the inclusive count of AIANs (alone and in combination) increased by 1.5%, indicating that there are growing AIAN needs in this region. This ten-year growth rate, however, is a smaller increase than for the total population in the county (an increase of 3.1%). Part of the difference may be due to the relative lack of international migration for AIANs. Immigration has been a driving force behind the growth of Hispanics and Asians in this region. The two AIAN subpopulations in Los Angeles, however, show distinctively different trajectories. The number of single-race AIANs (AIAN alone) decreased by -5.4%, while the number of multiracial AIANs (AIAN in combination) grew by 10.1%. At the same time, single-race AIANs still outnumbered multiracial AIANs in 2010.
The decennial data also show that the Los Angeles AIAN growth rates are considerably smaller than those for AIANs in California, which in turn are smaller than those for AIANs in the United States. At the national level, the inclusive AIAN count increased at more than twice the rate for the US population as a whole, and the number of multiracial AIANs increased about four times faster. There is no simple explanation for the differential growth for AIANs in Los Angeles and for the nation, and the discussion below provides some clues.
| Table 1 |
 |
| Source: ACS PUMS. |
Part 3: Age Distribution and the Decline of Youths
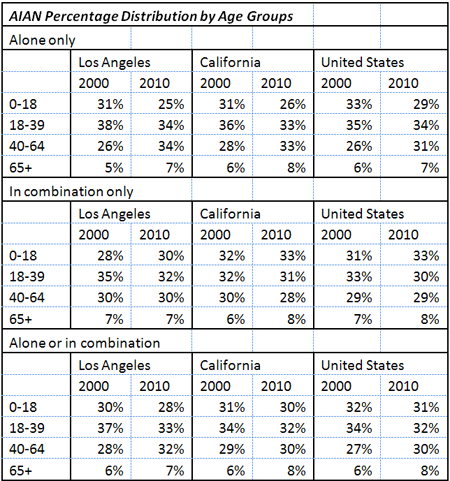
We analyze the age composition of AIANs by using categories associated with defining the "dependent" subpopulation. This group includes youths and elderly persons. For most of the world, this is defined as people younger than 15 or older than 64, but in the United States, the youth population is better defined as those under the age of 18. This section examines the dependency ratio for AIANs in 2000 and 2010 for Los Angeles, California and the United States. Unfortunately, the Bureau of the Census publishes detailed statistics for only single-race AIANs. We estimate the age distributions by tabulating the 1% 2000 PUMS for the United States, the 5% 2000 PUMS for California and Los Angeles County, and the 1% 2010 ACS PUMS for all three geographies. We use four age categories: youths (0-17), adults (18-39), older adults (40-64), and elderly (65 and older).
Table 2 summarizes the age distribution reported in the 2010 enumeration for the three AIAN counts for all three geographies. A key statistic for a given population is the age-dependency ratio, which is defined as the ratio of those usually outside of the working-age population to the working-age population. In Los Angeles, the ratio has decreased for single-race AIANs and increased for multiracial AIANs. The same pattern is observed for the state and nation. However, these ratios can be somewhat misleading because AIAN households can be comprised of both single-race and multiracial individuals. For the combined counts, the ratios show only moderate changes.
| Table 2 |
 |
| Source: ACS PUMS. |
A more important change is in the youth share of the AIAN population in Los Angeles. The tabulations indicate a dramatic decline among single-race AIANs, a decrease of about 6 percentage points. There are similar, but slightly smaller, declines for California and the United States. In all three geographies, the decline is partially offset by an increase in the youth share of the multiracial AIAN population.
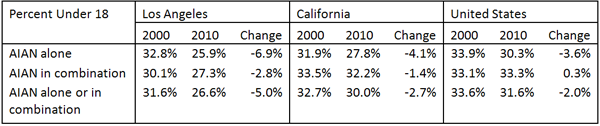
While the above estimates are based on small samples, thus subject to sampling errors, the published 2000 and 2010 enumeration data for single-race AIANs also show a decline in the youth share of the population. As reported in table 3, in Los Angeles, the proportion of youth decreased by nearly 7 percentage points for single-race AIANs, 5 percentage points for AIANs alone and multiracial, and about 3 for multiracial AIANs. These declines are significantly greater than for California or the nation as a whole. The only group that did not experience a decline in share of the total population is the combined single-race and multiracial AIAN youths at the national level.
| Table 3 |
 |
| Source: 2000 Census SF1, table P012C and 2010 Census SF1, table P12C. |
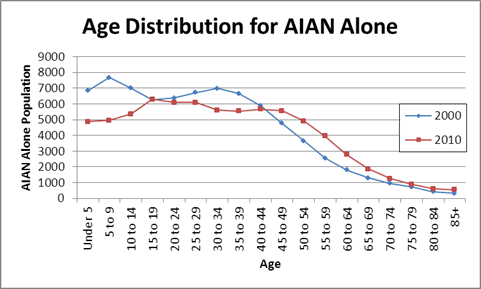
Additional analysis reveals that the relative (percent of the total population) and absolute (numbers of individuals) decline in Los Angeles is concentrated among those between the ages of 0 and 9, those born between the two decades. This can be seen in figure 2. The number of children declined by 4,710 or 32% over the ten-year period. One plausible explanation for this decline is a parallel decline in the number of childbearing-aged people (see fig. 3). However, this seems to be only a partial explanation, in part because the decline in youth may also be due to higher negative net migration than for other age groups and to changes in racial identity.
| Figure 2 |
 |
| Source: 2000 Census SF1, table P012C and 2010 Census SF1, table P12C. |
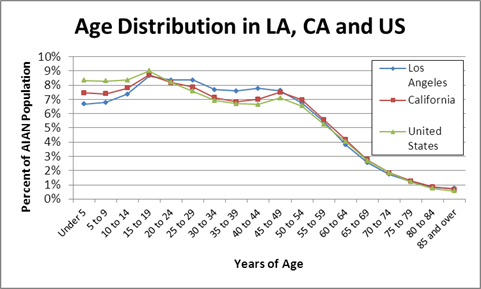
An alternative way of analyzing the possible implication of the decline in the number of childbearing AIANs in this region is to compare the age profiles of Los Angeles to that for the state and nation. As seen in figure 3, Los Angeles had relatively fewer youths and more childbearing-age adults. This implies that the fertility rate in Los Angeles is noticeably lower than for the other two geographies.
| Figure 3 |
 |
| Source: 2000 Census SF1, table P012C and 2010 Census SF1, table P12C. |
Part 4: Births
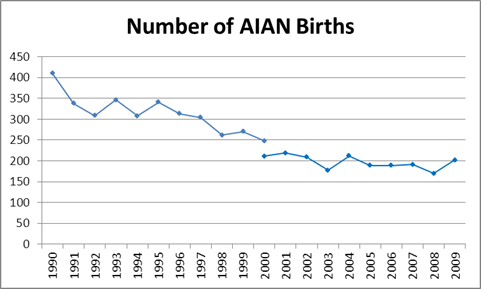
Other indicators are a decline in birthrates and a decline in school-aged children. From 1990 to 1999, there were 3,201 AIAN births in Los Angeles; from 2000 to 2009, there were only 1,969. The Los Angeles Department of Public Health changed its reporting method and added a category for two or more races. Two different numbers were reported for 2000 by the Department of Public Health, but the number from the more recent data—after the Department of Public Health reported two or more races—is used here (see fig. 4).
The 2000 number when two or more races were reported was 85.1% of the previous 2000 number. If the 1990-1999 numbers are adjusted by the ratio derived by comparing the two different 2000 figures, then there were an estimated 2,723 AIAN alone births between 1990 and 1999. Compared to this figure, there were only 72.3% of the number of births in the 2000–2010 period. Compared to the census, which reported 14,520 children under the age of 10 in 2000 and 9,810 in 2010, there were only 67.6% of the number of children under age 10 in 2010 compared to 2000.
| Figure 4 |
 |
| Source: Los Angeles County Department of Public Health, 2000 Perinatal Indicators and 2009 Perinatal Indicators. |
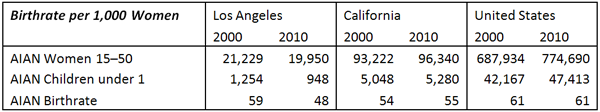
The U.S. Bureau of the Census reports fertility as the number of births in the last 12 months per 1,000 women aged 15-50 in the ACS. This can be calculated for the 2000 and 2010 enumeration by calculating the ratio of children under 1 to the number of women aged 15-50. As shown in table 3, while the rate stayed steady on the national level and slightly grew in California, there was a large drop in the Los Angeles levels. However, this estimation only accounts for a single year of births. Unlike the ACS, only AIAN mothers who have an AIAN alone child are counted in this estimate.
| Table 4 |
 |
| Source: 2000 Census SF1, table PCT012C and 2010 Census SF1, table PCT12C. |
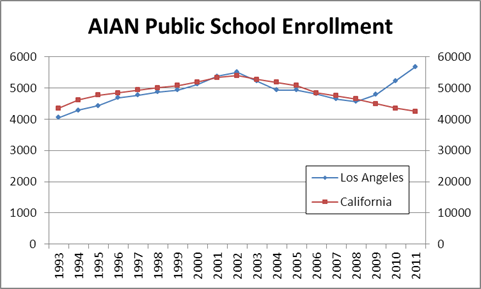
The data from school enrollment information provided by the California Department of Education is consistent with fewer children, and the information from the Department of Health of fewer births, showing a recent trend that may indicate a reversal (see fig. 5). The California Department of Education data are representative of school-aged children who attend public schools, and not all people under age 18. Snipp also indicated a lower observed fertility rate in urban areas, although this may be related to changes in self-identication in urban areas (Snipp, 1997).
| Figure 5 |
 |
| Source: Los Angeles Unified School District. |
Part 5: Deaths and Net Migration in Los Angeles
This section estimates deaths and net migration in Los Angeles. The first step is to modify the formula for population over two time periods. The starting point is the equation listed in the introduction:
We start with a base population (t-1=2000) that is ten years or older. This means that the birth component drops out of the formula. We can further simplify at this point by assuming no net change in racial identity, a subject that is discussed in the next section. With these assumptions, the formula is reduced to:
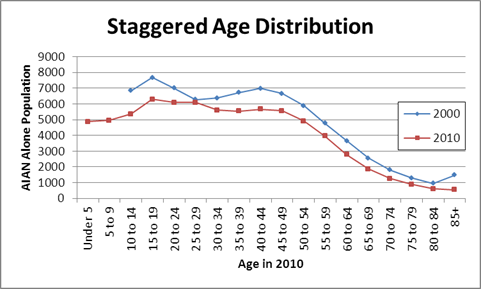
In other words, the observed surviving and/or remaining population at time "t" (2010) is the base population minus deaths plus net migration (which could be either positive or negative). Figure 6 provides a visual representation of this for Los Angeles, with the single-race AIAN population broken down in five-year age groups. Unfortunately, we do not have detailed age data for multiracial AIANs and for the combined population (single-race and multiracial together), thus are not able to estimate deaths and net migration. The 2000 line is shifted to the right by ten years, corresponding to the time interval between the two enumerations. The gap between the top line (2000) and the bottom line (2010) is due to deaths and net migration.
| Figure 6 |
 |
| Source: 2000 Census SF1, table P012C and 2010 Census SF1, table P12C. |
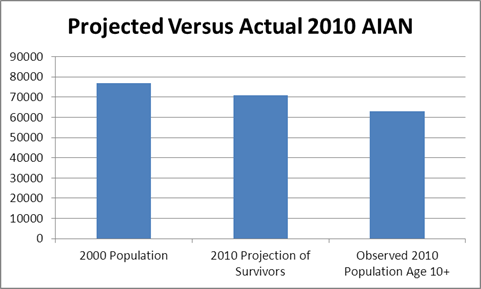
We estimated the number of survivors by first estimating the number of deaths, using IHS national level mortality rates from the report, "Indian health Care." Using this data, an estimated survival rate was calculated for each age bracket based on the IHS brackets by weighing the survival rates by the years each cohort would spend in that bracket over the ten-year period. The survival rate was then compounded each year in order to estimate the survivors from each age bracket, then summed to estimate the total number of survivors. Based on these calculations, we would expect to see in 2010 roughly 71,000 single-race AIANs ten years and older, assuming no out- or in-migration. However, the actual AIAN population was significantly lower (63,000), indicating that net migration was negative (8,000), thus contributing to the observed reduction in the number of AIANs in this region (see fig. 7). The impact of net migration, however, can be either under- or overestimated because the above does not account for shifts in racial identity between the two decades.
| Figure 7 |
 |
| Source: 2000 Census SF1, table P012C and 2010 Census SF1, table P12C, "Indian health Care." |
Part 6: Shifting Racial Identity at National Level
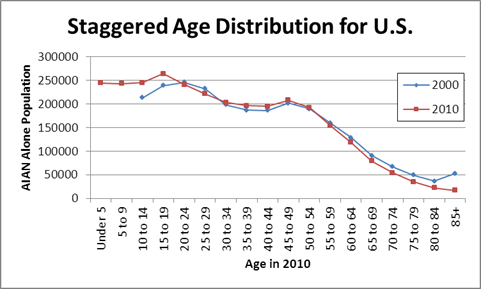
We examine the issue of possible shifting racial identity by examining changes at the national level. This is possible because of simplifying assumptions. The starting forumula is again the one taken from the introduction:
As done in the previous section, we drop the birth component by starting with a base population (t-1=2000) that is ten years or older. Fortunately, there is a way to observe net migration at the national level because it must by definition be due to net international migration. We will return to this later. With these assumptions, the formula is reduced to:
In other words, the observed population at time "t" (2010) is the surviving base population plus net change in racial identity, which could be either positive or negative. Figure 6 provides a visual representation of this for the single-race AIAN population broken down by age groups, with the 2000 line shifted to account for the decade time difference. The gap between the top line (2000) and the bottom line (2010) is due to deaths and shifting identity.
| Figure 8 |
 |
| Source: 2000 Census SF1, table P012C and 2010 Census SF1, table P12C. |
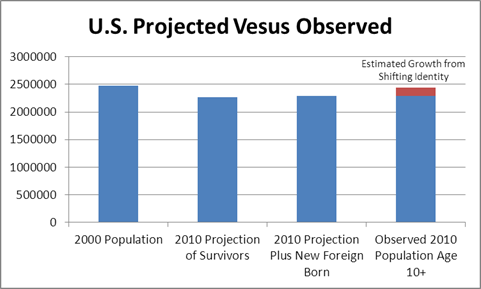
We use the same method to calculate deaths and the suriving population. We esimated the number of suvivors to be approximately 2,267,000 out of the base population of 2,476,000. The estimate is considerably lower than that reported for 2010: 2,444,000. We account for net international migration by comparing the number of foreign-born AIANs counted in the 2000 decennial census and in the 2006-10 American Community Survey, which shows a net growth of 23 thousand. Even after making this adjustment, there is still a sizable growth that cannot be accounted for by death and net migration. This "excess" growth is estimated to be 6.3% of the observed 2010 population over age ten, or about 154 thousand (see fig. 9). Although we have no evidence that shifting racial identity has affected the AIAN count in Los Angeles, the national analysis demonstrates that this phenomon is both plausible and probable.
| Figure 9 |
 |
| Source: 2000 Census SF1, table P012C and 2010 Census SF1, table P12C, "Indian health Care," ACS 2010 5-year, table B05003C and Census 2000 SF3, table PCT063C. |
Conclusion
The above analyses find that there is a decline in the number of single-race AIANs in Los Angeles and a modest growth for the multi-race and the inclusive counts between 2000 and 2010. This pattern contrasts with higher growth rates at the state and national level. Much of the decline in this region is concentrated among the youths, which is due in part to declining birthrates and fewer childbearing-age females. Deaths and net out-migration also contributed to the decline. While shifting racial identity is a measurable phenomenon at the national level, a lack of data prevents us from estimating the impact of this in Los Angeles. While the evidence of a decline or slow growth is fairly strong, a demographic analysis alone does not explain the observations. Analysis of socioeconomic trends points to one plausible cause, that is, a severe impact of the "great recession" on AIANs in this region. That topic will be covered in the next analytical memo.
References
Cheney, Paul. "Chapter 17." Intro to Sociology. N.p., 2009. Web. 28 Aug. 2012. http://freebooks.uvu.edu/SOC1010/index.php/ch17-population.html.
Passel, Jeffrey S. "The Growing American Indian Population, 1960-1990: Beyond Demography." Population Research and Policy Review 16 (1997): 11–31.
Snipp, Matthew C. "The size and distribution of the American Indian population: Fertility, mortality, migration, and residence." Population Research and Policy Review 16 (1997): 61-93.
"Census Bureau Releases Estimates of Undercount and Overcount in the 2010 Census." Newsroom: 2010 Census: Census Bureau Releases Estimates of Undercount and Overcount in the 2010 Census. U.S. Bureau of the Census, 22 May 2012. Web. 24 Aug. 2012. http://www.census.gov/newsroom/releases/archives/2010_census/cb12-95.html.
"Census in the Constitution." Census in the Constitution—2010 Census. U.S. Bureau of the Census, n.d.a Web. 24 Aug. 2012. http://2010.census.gov/2010census/about/constitutional.php.
"Explore the Form." Explore the Form-2010 Census. U.S. Bureau of the Census, n.d.b Web. 28 Aug. 2012. http://2010.census.gov/2010census/about/interactive-form.php.
1 This technical memo is a collaborative work by UCLA American Indian Studies Center and the Los Angeles Urban Indian Roundtable. We would like to thank reviewers for their input, feedback, and comments. The authors are solely responsible for the contents of this report.
|
American Indian Studies Center 3220 Campbell Hall, Box 951548 Los Angeles, CA 90095-1548 |
Phone: (310) 825-7315 Fax: (310) 206-7060 Email: aisc@ucla.edu |
AISConnect →


|
|