Los Angeles American Indian and Alaska Native Project1
Technical Memo 2:
2011 Los Angeles AIAN Economic Indicator Brief
Jonathan Ong and Paul Ong
November 16, 2012
Introduction
This analytical brief examines the impact of the "Great Recession" on American Indians and Alaska Natives (AIANs) in Los Angeles in comparison with Non-Hispanic Whites (NHWs) and the total population. The National Bureau of Economic Research (NBER) is considered the primary arbitrator in determining the timing of business cycles. According to NBER, a recession is the period between an economic peak and an economic trough. During a recession, as the economy contracts, unemployment rises and income falls, leading to an increase in poverty. NBER stated that the recession started in December 2007 and ended in June 2009 (NBER, 2010). Despite NBER declaring the end of a recession, economic growth has been slow, and employment recovery seriously lags behind (U.S. Department of Labor, 2012).
The last recession was the longest and deepest downturn since the Great Depression and the worst U.S. contraction since the Great Depression in the 1930s, and the recent slowdown has become commonly known as the "Great Recession" because of the great depth and great length resulting in an especially large impact on workers (Wall Street Journal, 2009; DALLASFED, 2012). The Great Recession has disproportionately affected Los Angeles adversely. Unemployment rates for the nation and Los Angeles were similar before the recession; the difference was only 0.2 percentage points in 2006. However, during the recession, the gap widened. The Los Angeles rate was 3.4 percentage points higher than the national rate in 2011 (see fig. 1).2 The most recent unemployment rate statistics (September 2012) show a gap of more than 2 percentage points between Los Angeles County and the United States (10.2% versus 7.8%) (Bureau of Labor Statistics, 2012).
| Figure 1 |
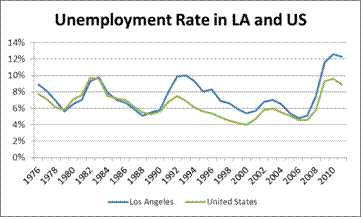 |
| Source: California Employment Development Department. |
We examine the impacts of the recent economic cycle on AIANs in Los Angeles by analyzing several indicators before the Great Recession and during the years of high unemployment. The recession officially started in December 2007; therefore, the 2005–07 averages represent a pre-recession period. Although the economic recession ended in 2009, the recovery in employment lagged behind the recovery in GDP. The 2009–11 years represent a period that captures the most severe impacts of the Great Recession on the labor market. Figures for the two time periods (2005–07 and 2009–11) come from the Census Bureau's three-year tabulations of the American Community Survey. Three-year periods are used to minimize statistical error due to the small sample sizes of AIANs. This memo is broken down into two parts: first is the labor market and second is income and poverty, which are both affected by variations in the labor market.
Part 1: Labor Market
The analysis of ACS data reveals that AIANs were more severely and adversely impacted than the rest of the population. This can be seen in the first labor market indicator, which is the unemployment rate, the most common and widely used indicator of labor-market performance. The data show that the recession had a greater impact on AIANs. The unemployment rate is the percentage of the labor force that is not employed but actively seeking work. In the 2005–07 period, AIANs had a higher unemployment rate compared with either NHWs or the total population. This disparity grew even wider, and the unemployment rate in the latter period (2009–11) was more than 14%, meaning one in seven AIANs in the labor force did not have a job. The unemployment rate rose by 6.0 percentage points for AIANs between the two periods, compared with an increase of only 4.6 percentage points for NHWs and 5.0 percentage points for the total population (see fig. 2).
| Figure 2 |
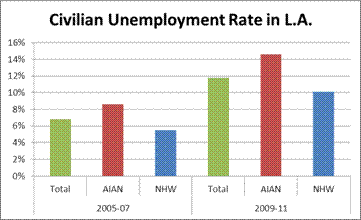 |
| Source: 2005–07 and 2009–11 ACS. |
The changes in unemployment are worse for men, especially among AIANs. The increase in unemployment for AIAN men was far worse than for either NHW men or the total population; however, the reverse is true for AIAN women who did not experience as much of a rise in unemployment as their counterparts (see table 1).
| Table 1 |
 |
| Source: 2005–07 and 2009–11 ACS. |
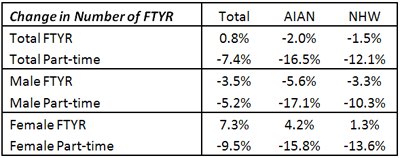
The second indicator is the proportion of workers who are full-time, year-round (FTYR) workers, which is defined by the census as people age 16 and older working at least 35 hours per week for 50 or more weeks per year. We calculate the FTYR rate as the number of FTYR workers with earnings divided by all workers with earnings. The rate of FTYR employment for AIANs increased by 3.9 percentage points (54.5% versus 58.4%). In comparison with NHWs and the total population, AIANs working FTYR increased the most, meaning that, inversely, there was a bigger drop in the relative proportion of part-time workers (see fig. 3). For NHWs, full-time employment increased by 2.8 percentage points (56.5% versus 59.2%) and increased by 2.0 percentage points (58.9% versus 61.0 %) for the total population.
| Figure 3 |
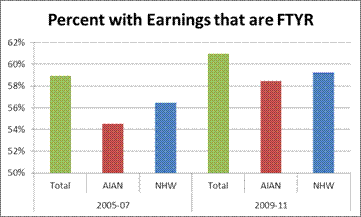 |
| Source: 2005–07 and 2009–11 ACS. |
The above changes are due to disparate patterns by gender. Males are more likely to be laid off during an economic downturn, with those marginally employed (working only part-time) to be most at risk. Females are also affected, but some are compelled to increase their employment when possible in response to a decline in spousal earnings. These changes in the number of part-time workers are drastic, especially for AIANs who see a greater decline in the number of both male and female part-time workers and male FTYR workers when compared with NHWs or the overall population (see table 3). The aforementioned vulnerability of part-time workers is likely the reason for the relative increase in the number of full-time workers as a proportion of all workers. While overall the total population saw an increase in the absolute number of FTYR workers, AIANs decreased more than NHWs; however, for all three categories, women gained in FTYR employment between the two periods
| Table 2 |
 |
| Source: 2005–07 and 2009–11 ACS. |
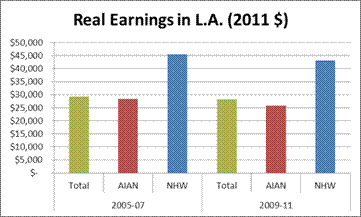
The third indicator is earnings, which are calculated by the U.S. Census for all workers over age 16 with earnings. Workers without earnings are not factored in, so neither the unemployment rate nor labor force participation affects the level of worker earnings. Earnings are inflation-adjusted and reported as 2011 dollars. Earnings were lower for AIANs compared to either the NHWs or the total population. Median earnings fell for AIANs more than NHWs or the total population both in dollars and as a percentage of base-year earnings. Median AIAN earnings in 2011 dollars fell by 9.1% or nearly $2,600 (over $28,400 versus over $25,800) between the two periods (see fig. 4). For NHWs earnings fell by 5.3% or about $2,400 (over $45,500 versus about $43,100), and for the population as a whole it fell by 3.8% or about $1,100 (nearly $29,400 versus nearly $28,300 in 2011 dollars).
| Figure 4 |
 |
| Source: 2005–07 and 2009–11 ACS. |
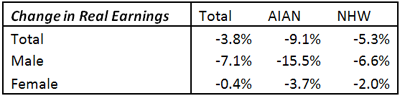
AIANs also saw a much larger decrease in earnings than NHWs or the total population for both men and women, meaning that the AIANs who did retain or find employment did so at lower wages or took larger pay cuts than either NHWs or the total population (see table 3). This change is most noticeable for men, although AIAN women also lost more earnings than their counterparts. The increased rate FTYR employment of women may explain why real earnings did not drop as much for women, but AIAN women still saw a significantly larger decrease in earnings than either NHWs or the total population.
| Table 3 |
 |
| Source: 2005–07 and 2009–11 ACS. |
Part 2: Income and Poverty
The labor-market impacts of the Great Recession have translated into lower income and higher poverty for AIANs.
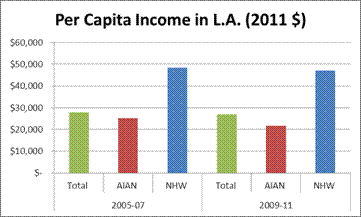
Per capita income is the total dollars for a population divided by the size of the population, which has been adjusted for inflation and is reported in 2011 in this report. During this period, the per capita income for AIANs disproportionately decreased far more than for the total population both in the number of dollars and in the proportion of income. Figure 5 reports per capita income in 2011 dollars. In the 2005–07 period, AIANs had a lower per capita income compared with either NHWs or the total population. Per capita income fell 14% (nearly $25,200 versus nearly $21,600) for AIANs between the two time periods, whereas it only declined by 3% (over $48,400 versus nearly $47,100) for NHWs and 4% (over $27,900 versus nearly $26,900) overall for the total population. In terms of dollars, per capita income fell by about $3,600 for AIANs, compared with a decline of over $1,300 for NHWs and under $1,100 for the total population.
| Figure 5 |
 |
| Source: 2005–07 and 2009–11 ACS. |
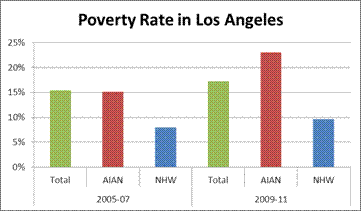
One of the most important socioeconomic indicators is the poverty rate, which gauges the relative size of population in a dire financial state. The origin of the poverty threshold is based on minimum food costs, developed in 1963–64 by Mollie Orshansky of the Social Security Administration. She described the poverty threshold as a measure of income inadequacy, rather than income adequacy. For a family of four with two children the poverty income threshold is $22,811 in 2011.3
During this period, the poverty rate for AIANs disproportionately increased far more than for the total population. The poverty rate rose by 7.8 percentage points (15.2% versus 23.0%) for AIANs between the two time periods, whereas it only increased by 1.6 percentage points (8.0% versus 9.6%) for NHWs and 1.8 percentage points (15.4% versus 17.2%) overall for the total population (see fig. 6).
| Figure 6 |
 |
| Source: 2005–07 and 2009–11 ACS. |
Conclusion
The analysis clearly shows that AIANs are amongst the most disadvantaged in Los Angeles, which is among the hardest hit in the nation. Within Los Angeles, AIAN unemployment is several percentage points higher than the regional average. One potential reason is that there are not sufficient employment services for AIANs during the downturn. Even after a full recovery it is likely that AIANs will continue to be disadvantaged in the labor market. This prediction is based on the fact that even in the better years (2005–07), AIANs had poorer labor market outcomes than NHWs and the total population. The implication is therefore that there is a need for solutions that address long-term employment barriers facing AIANs. Solutions require a greater understanding of the factors causing the problem.
How hard AIANs were hit may be related to the population decline documented previously.4 As employment prospects decline, many relocate to other areas or tribal lands for cheaper costs of living or other job opportunities, and the dampened job prospects may lead AIANs from other areas to decide not to move to the city.
Future research should look at what the barriers are to meaningful employment. Possible reasons are limited human capital (education, etc.), access to employment-related networks and resources, and/or discrimination.
1 This technical memo is a collaborative work by the UCLA American Indian Studies Center and the Los Angeles Urban Indian Roundtable. We would like to thank reviewers for their input, feedback, and comments. The authors are solely responsible for the contents of this report.
2 California's unemployment rates are very close to Los Angeles' throughout the period.
4 Jonathan Ong and Paul Ong, "Technical Memo 1: Population Change & Components of Change," UCLA American Indian Studies Center, November 2012. http://www.aisc.ucla.edu/research/pb1_memo1.aspx
|
American Indian Studies Center 3220 Campbell Hall, Box 951548 Los Angeles, CA 90095-1548 |
Phone: (310) 825-7315 Fax: (310) 206-7060 Email: aisc@ucla.edu |
AISConnect →


|
|