Los Angeles Urban Indian Roundtable
![]() Published by the UCLA American Indian Studies Center
Published by the UCLA American Indian Studies Center
Policy Brief Number Two, November 2012
Los Angeles American Indian and Alaska Native Project1
The Status of American Indians/Alaska Natives in Los Angeles: The Great Recession and American Indians
Paul M. Ong and Jonathan D. Ong
November 14, 2012
Introduction
Recent months have witnessed an improving labor market, and hopefully the pickup in employment opportunities will benefit American Indians/Alaska Natives (AIAN). The road to full AIAN employment, however, is likely to be long and problematic because they were disproportionately hurt by the Great Recession. This policy memo examines impacts of the recent downturn on AIANs relative to their socioeconomic status prior to the recession and relative to other groups.
The last economic recession, commonly known as the Great Recession, was labeled as such because it is the longest and deepest downturn since the Great Depression of the 1930s. As the economy contracts, joblessness rises and income falls, leading to an increase in poverty. The business recession officially started in December 2007 and ended in June 2009 (NBER, 2010). Despite declaring a turnaround, economic growth has been slow, and employment recovery seriously lags behind (U.S. Department of Labor, 2012).
This policy brief examines population trends of AIANs in Los Angeles County based largely on American Community Survey data, focusing on the two periods of 2005–07 and 2009–11. The year 2008 is transitional because the downturn in the labor market lags behind the economic recession. The 2005–07 phase represents a time period before the Great Recession and 2009–11 represents the period severely impacted by the Great Recession. The analysis produces three key findings: Los Angeles was disproportionately and negatively affected by the Great Recession, AIANs in Los Angeles had been worse off than the rest of the population before the Great Recession, and AIANs in Los Angeles have lost more financially than others during the recent downturn.
The Great Recession and Los Angeles
The impact of the Great Recession in Los Angeles can be seen in the unemployment rates. The national and regional levels were similar before the recession, a difference of only 0.2 percentage points in 2006. The gap widened during the recession. The Los Angeles rate was 3.4 percentage points higher than the national rate in 2011 (see fig. 1). The most recent unemployment rate statistics (September 2012) indicates an improvement. but nonetheless there is still a gap of more than two percentage points (10.2% versus 7.8%) (Bureau of Labor Statistics, 2012). Despite the ending of the business recession, Los Angeles has not yet recovered to pre-recession levels.
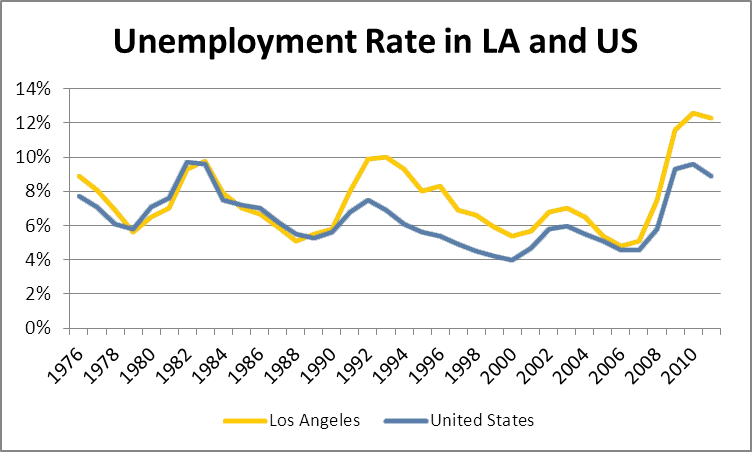
Figure 1. Source: CA EDD
Impact of the Great Recession on AIANs
Prior to the Great Recession (2005–07), AIANs were socioeconomically worse off than non-Hispanic Whites (NHW), and were near parity with the entire population. Of these four categories, AIANs were worse off than either NHWs or the overall population with the exception of the poverty rate, in which AIANs fared slightly better than the total population, but worse than NHWs (see table 1).
|
Table 1 |
|
|
||||||
|
|
Unemployment Rate |
Poverty Rate |
Median Earnings* |
Per Capita Income* |
||||
|
2005–07 |
2009–11 |
2005–07 |
2009–11 |
2005–07 |
2009–11 |
2005–07 |
2009–11 |
|
|
Total |
6.8% |
11.8% |
15.4% |
17.2% |
$29,389 |
$28,284 |
$27,945 |
$26,893 |
|
AIAN |
8.6% |
14.6% |
15.2% |
23.0% |
$28,425 |
$25,843 |
$25,194 |
$21,584 |
|
NHW |
5.5% |
10.1% |
8.0% |
9.6% |
$45,524 |
$43,107 |
$48,424 |
$47,075 |
|
*All dollar figures in this table are in inflation-adjusted 2011 dollars. |
||||||||
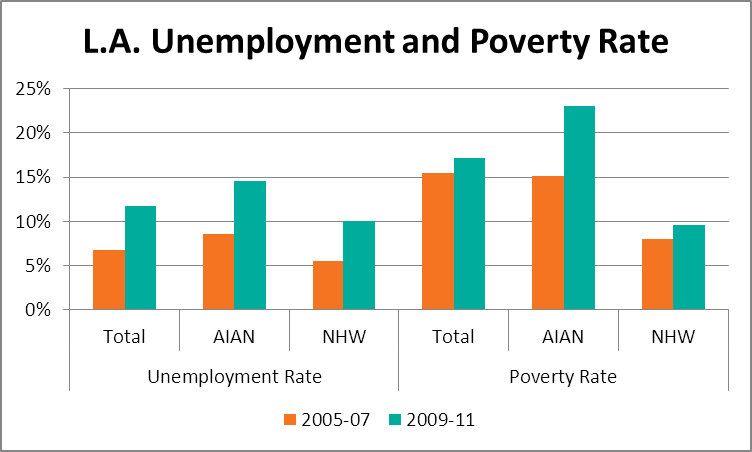
In the wake of the Great Recession, AIANs were more severely and adversely impacted than the rest of the population. With the labor market lagging behind the official recovery in GDP, AIANs became even more disadvantaged, and were worse off in unemployment, poverty, earnings, and income than either NHWs or the total population.
This disparity in unemployment between AIANs and NHWs grew wider. The unemployment rate rose by 6.0 percentage points for AIANs between the 2005–07 and 2009–11 periods, compared with an increase of only 4.6 percentage points for NHWs and 5.0 percentage points for the total population. One in seven AIAN workers did not have a job.
The poverty rate is one of the most significant indicators of socioeconomic status, measuring the population without adequate income. For a family of four with two children the poverty income threshold was $22,811 in 2011. During this period, the rate for AIANs disproportionately increased far more than for the total population. The poverty rate rose by 7.8 percentage points (15.2% versus 23.0%) for AIANs between the two time periods, whereas it increased by only 1.6 percentage points (8.0% versus 9.6%) for NHWs and 1.8 percentage points (15.4% versus 17.2%) overall for the total population During the latter period, nearly one in four AIANs was below the federal poverty level.
AIAN earnings and per capita income, both reported in constant dollars, fell more in absolute dollars and in relative terms, thus increasing the gap between AIANs and NHWs, as well as the rest of the population. Median AIAN earnings fell by 9.1% or nearly $2,600 between the two periods. By comparison, earnings fell by 5.3% or about $2,400 for NHWs and 3.8% or about $1,100 for the total working population. Per capita income fell 14% for AIANs between the two time periods, whereas it declined by only 3% for NHWs and 4% overall for the total population. In absolute dollars, per capita income fell by about $3,600 for AIANs, compared with a decline of more than $1,300 for NHWs and less than $1,100 for the total population.
Even though everyone was worse off after the Great Recession, it was far worse for AIANs, leaving them even further behind socioeconomically than they were before the Great Recession. One of the intriguing findings is that the labor force participation rate is high among AIANs and it increased during the Great Recession.2 Despite the fact that AIANs are relatively more attached to the labor market, many remain among the working poor.
Policy Implications
The analytical findings point to several policy recommendations:
- 1. Given the severity of the Great Recession on AIANs, it is essential that AIANs have full access to culturally appropriate programs that improve educational and workforce readiness.
- 2. Beyond addressing the impacts of the business cycle, public agencies must address longtime barriers to meaningful employment that provides full-time work with a living wage. Even in better times AIANs are economically disadvantaged.
- 3. Existing city and county programs need to collaborate with AIAN community groups with the expertise, social networks, and cultural knowledge to reach this population.
- 4. There should be support for other Family Economic Success strategies, such as Volunteer Income Tax Assistance sites, Earned Income Tax Credit campaigns, culturally based financial education, and other asset-building strategies.
- 5. Partnerships between the AIAN community and entities such as private business, nonprofit organizations, and community development corporations must be strengthened and cultivated, so there is a wider range of culturally appropriate training and job placement programs available to AIANs.
Acknowledgments
This brief was commissioned by the Los Angeles City/County Native American Indian Commission and the American Indian Community Council, and was co-developed with the Los Angeles Urban Indian Roundtable.

The Los Angeles Urban Indian Roundtable members include:
American Indian Chamber of Commerce
American Indian Community Council
American Indian Healing Center
Fernandeño Tataviam Band of Mission Indians
Los Angeles City/County Native American Indian Commission
Pukúu Cultural Community Services
Red Circle Project
Southern California Indian Center
Title VII at Los Angeles Unified School District
Torres Martinez Tribal Temporary Assistance for Needy Families
UCLA American Indian Studies Center
United American Indian Involvement
We would like to thank our sponsors, The California Wellness Foundation and Los Angeles County Board of Supervisor Don Knabe, for their generous support. We would also like to thank the authors, Paul Ong and Jonathan Ong, as well as the American Indian Studies Center for supporting this project.
1 This policy brief is a collaborative work by UCLA AISC and the Los Angeles Urban Indian Roundtable. We would like to thank reviewers for their input, feedback, and comments. The authors are solely responsible for the contents of this report.
2 The labor force participation rate rose by 1.9 percentage points (64.0% versus 65.9%) for AIANs between the two time periods, whereas it increased by only 1.2 percentage points (63.1% versus 64.3%) for NHWs and 1.1 percentage points (64.1% versus 65.2%) for the total population. Future research should examine what factors produced this result.
|
American Indian Studies Center 3220 Campbell Hall, Box 951548 Los Angeles, CA 90095-1548 |
Phone: (310) 825-7315 Fax: (310) 206-7060 Email: aisc@ucla.edu |
AISConnect →


|
|