Los Angeles American Indian and Alaska Native Project
[1]
Technical Memo 3:
Working but Struggling
Jonathan Ong and Paul Ong
June 3, 2012
Revised July 25, 2013
Introduction
This technical memo examines
labor-market outcomes for American Indians and Alaska Natives (AIANs),
particularly compared to non-Hispanic Whites (NHW) in Los Angeles County. The
analysis uses data from the 2007-11 American Community Survey (ACS).
Descriptions of this data source can be found in previous technical memos. When
possible, the project utilizes tabulations published online by the Bureau of
the Census (http://factfinder2.census.gov/faces/nav/jsf/pages/index.xhtml).
That information is based on the full sample of respondents, which covers more
than 12% of the population. The project also uses the 2007–2011 ACS public-use
micro sample (PUMS), which contains individual level information for about 5%
of the population. PUMS allows the project to customize the analysis to examine
issues not adequately addressed by or reported in published statistics.
The rest of the memo is organized in
four sections. The first provides an overview of the labor-market status of
AIANs and other major groups. The second section compares annual earnings, both
the averages and relative proportions at the bottom of the economic ladder. The
third section analyzes the earnings gap between US-born non-Hispanic Whites and
AIANs, and whether a gap between the two groups in income remains after
accounting for human capital. The last section examines the paradoxical role of
low educational attainment and high returns to schooling for AIANs.
The empirical findings show that AIANs
are active in the labor market, but a disproportionately high number are
struggling. They have a harder time finding work, earn less, and are more
concentrated in the low-income sector. The results indicate that the economic
disadvantages are due both to less education and labor-market barriers such as discrimination.
On the other hand, the analysis reveals that AIANS experience considerable
economic benefits from higher educational attainment.
Part
I: Overview of Labor Market Status
Table 1 summarizes the available
information on the labor-market status of the 16 years and older population.
Statistics are based on the categories used by the Bureau of the Census and reported
for the major racial/ethnic groups and by sex. The figures for AIANs, Asians,
and African Americans (aka "Blacks") are based on the single race category
(that is, the numbers do not include those who are multiracial), and the
Hispanic category includes all Hispanics (aka "Latinos") regardless of race.
The NHW category includes those who are white alone and not of Hispanic
origins. The analysis in this section uses three common indicators: the
labor-force participation rate, the unemployment rate, and the
full-time/full-year rate. The definitions are given below.
As with other studies of the economic
effects of race, the NHW population is taken as the reference group because
members of this population face fewer labor-market barriers than minority
workers. Moreover, using this benchmark is desirable because NHWs and AIANs are
predominantly US-born; thus they should be more comparable in the absence of
barriers confronting AIANs. Being US-born, however, does not ensure equal
outcomes, and this is apparent for African Americans. They have the same
nativity characteristics as NH whites (mostly US-born), but Blacks have been
extremely disadvantaged by past and current discrimination and
institutionalized racism. Comparisons with Asians and Hispanics should be
viewed cautiously because both groups are predominantly foreign-born. Their
labor-market characteristics
and dynamics are complicated by American
immigration policies and practices that produce selective migration patterns.
The net results are a very highly educated Asian labor force and a far less
educated Latino labor force. Moreover, linguistic and cultural factors affect
the dynamics of economic incorporation and assimilation of foreign-born workers.
The analysis examines outcomes by sex
because males and females have different relationships with paid work. Female
participation tends to be lower and less continuous than male participation because
a division of tasks still exists within a family or household. Women take on more
of home duties such as childrearing, cleaning, and shopping. Females also
encounter employment discrimination, which can have a noticeable effect on
labor-market outcomes. The gender bias in the social division of household
duties and overt sexism has waned, but neither has disappeared.
The broadest measure of the level of
labor-market activity is the labor-force participation rate (LFPR), which is
defined as the proportion of the 16 and older population that is either
employed or actively seeking employment. This economically engaged segment of
the population is categorized as being "in the labor force," and the analysis
focuses on the civilian sector (that is, excluding those in the armed forces
when possible). AIAN LRPFs are roughly comparable to those for the total
population and for NHWs, and this holds regardless of sex. (Not surprisingly,
the LFPRs for females are consistently lower than for males.) In other words,
the data show that AIANs are economically active.
Table 1: Labor Market Status
|
||||||
Total
|
NHWs
|
Asians
|
Blacks
|
AIANs
|
Hispanics
|
|
Both Sexes, 16 & older
|
|
|
|
|
|
|
Labor Force Participation
|
65.1%
|
64.5%
|
62.9%
|
60.7%
|
64.7%
|
67.2%
|
Unemployment Rate
|
9.8%
|
8.3%
|
7.5%
|
14.6%
|
12.0%
|
10.6%
|
  FTFY Rate
|
61.2%
|
59.1%
|
64.9%
|
60.3%
|
58.6%
|
61.9%
|
Male
|
|
|
|
|
|
|
Labor Force Participation
|
72.6%
|
71.3%
|
68.7%
|
61.7%
|
71.0%
|
77.0%
|
Unemployment Rate
|
9.8%
|
8.8%
|
8.0%
|
16.1%
|
11.2%
|
10.0%
|
FTFY Rate
|
66.1%
|
64.6%
|
69.0%
|
61.0%
|
63.7%
|
67.3%
|
Female
|
|
|
|
|
|
|
Labor Force Participation
|
58.0%
|
57.7%
|
58.0%
|
59.8%
|
58.2%
|
57.6%
|
Unemployment Rate
|
9.8%
|
7.8%
|
7.2%
|
13.1%
|
12.8%
|
11.5%
|
FTFY Rate
|
55.4%
|
52.5%
|
60.8%
|
59.7%
|
51.9%
|
54.7%
|
FTFY refers to full-time, full-year work. Source: 2007–2011 ACS. |
||||||
Despite being active in the labor
market, AIANs have a harder time finding work. This can be seen in the
unemployment rate (UR), which is the percent of the civilian labor force that
does not have a job (which is calculated by dividing the number of unemployed
by the sum of the employed and unemployed). Nearly one in eight AIANs in the
labor market is without a job, nearly one and a half times as prevalent as for
NH whites. This disparity holds for both male and female AIANs. Moreover, the
AIAN URs are higher than those for the total labor force, Asians, and
Hispanics. Only Blacks have a higher unemployment rate. The statistics clearly
show that AIANs are among the most disadvantaged in terms of encountering
difficulties in finding work.
Along with higher unemployment rates,
AIANs are less likely to work full time and full year (FTFY), which is defined
as having worked at least 50 weeks in the previous year, averaging at least 35
hours per week. The FTFY rate is the FTFY workers as a percent of all who
worked in the previous year. The AIAN LFPR is over three percentage points
lower than the population (16 and older). In fact, the AIAN rate is lower than
those for all other racial/ethnic groups. The gap is much larger among females.
Part
II: Annual Earnings
AIANs are also disadvantaged in terms of
annual earnings. Table 2 reports median annual earnings. The median is the
amount that divides the working population so half earn more and half earn
less. Earnings include both paid employment and income from self-employment,
and the amounts are reported in 2011 dollars. The medians for both sexes
combined (top third of the table) are estimated by the authors from categorical
data. The typical (median) AIAN worker earned 58¢ for every dollar earned by the
typical NHW worker, an amazing large disparity. The typical AIAN also earned
less than the total working population, Asians, and African Americans. The
disparity is slightly lower among FTFY workers but still substantial, with
AIANs earning 60¢ for every dollar earned by the typical NHW worker, but the
AIAN-NHW gap is larger among those working less than FTFY.
Table 2: Median Earnings in the Past 12 Months
|
||||||
Total
|
NH Whites
|
Asians
|
Blacks
|
AIANs
|
Hispanics
|
|
Both Sexes
|
|
|
|
|
|
|
Total
|
$29,348
|
$44,446
|
$36,100
|
$31,714
|
$25,797
|
$21,510
|
FTFY
|
$41,334
|
$63,157
|
$48,052
|
$44,190
|
$38,000
|
$29,255
|
Not FTFY
|
$12,758
|
$17,242
|
$13,918
|
$12,085
|
$11,192
|
$11,145
|
Male
|
|
|
|
|
|
|
Total
|
$31,972
|
$52,719
|
$39,795
|
$32,459
|
$27,446
|
$23,892
|
FTFY
|
$42,377
|
$71,638
|
$50,800
|
$45,389
|
$39,180
|
$30,024
|
Not FTFY
|
$14,218
|
$20,086
|
$14,973
|
$12,479
|
$11,735
|
$12,489
|
Female
|
|
|
|
|
|
|
Total
|
$25,920
|
$36,601
|
$32,387
|
$31,064
|
$22,343
|
$18,674
|
FTFY
|
$39,399
|
$54,029
|
$44,989
|
$42,975
|
$36,321
|
$27,381
|
Not FTFY
|
$11,749
|
$15,626
|
$13,077
|
$11,738
|
$10,641
|
$9,984
|
| Source: 2007–2011 ACS. | ||||||
The AIAN-NHW gap is larger among males
(the relative difference in the median for NHW males and AIAN males) than among
females (the relative difference in the median for NHW females and AIAN
females). The latter phenomenon (smaller gap among females) is due in part to
the fact that NHW females earn considerably less than their male counterparts
(NHW males). Nonetheless, the data indicate that AIAN females earn less because
of their race and gender.
As a consequence of earning less, AIANs
are more concentrated in the lower economic rungs, which can be seen in Table
3. The top half of the table reports the percent of each group falling into two
low-income categories, those earning less than $10,000 and those earning
between $10,000 and $19,999. Among all workers (both FTFY and non-FTFY), AIANs
have the highest odds of being in the lowest category, with nearly one in five
earning less than $10,000. AIANs are also more likely to be in the next income
category relative to all workers, NH whites, Asians, and African Americans. In
other words, AIANs are disproportionately more likely to be low-income workers,
to be among the "working poor."
An alternative measure of the economic
status of workers is the economic well-being of their families. Data on
individual earners do not capture the complexity of families. The same income
has very different consequences on the quality of life for a small family than
for a large family. The alternative approach is to classify workers according
to the federal poverty line (FPL), which is based on approximately three times
the cost of the typical food basket for a family according to size. For the 48
states on the mainland, the 2001 FPL ranges from $11,484 for a single person to
$23,021 for a family of four and to $39,069 for a family of eight. There are
slight adjustments to the FPL depending on whether the head is elderly or not
and on the ratio adults to children.
Table 3: Employed by Earnings and Poverty Categories |
|||||||
Total
|
NHWs
|
Asians
|
Blacks
|
AIANs
|
Hispanics
|
||
By Annual Earnings
|
|
|
|
|
|
|
|
All Employed
|
|
|
|
||||
$9,999 or Less
|
17.1%
|
15.0%
|
14.9%
|
18.3%
|
20.2%
|
18.9%
|
|
$10,000 to $19,999
|
18.8%
|
10.8%
|
13.6%
|
14.6%
|
19.8%
|
27.2%
|
|
FTFY Employed
|
|
|
|
||||
$9,999 or Less
|
2.2%
|
1.5%
|
1.8%
|
1.9%
|
3.5%
|
2.8%
|
|
$10,000 to $19,999
|
15.2%
|
5.1%
|
9.1%
|
9.5%
|
13.6%
|
25.5%
|
|
By Poverty Status
|
|
|
|
|
|
|
|
All Employed
|
|
|
|
||||
Less Than 1.5x FPL
|
16.9%
|
8.4%
|
11.0%
|
16.7%
|
19.3%
|
25.1%
|
|
1.5-2.49x FPL
|
18.2%
|
9.3%
|
14.2%
|
16.7%
|
22.0%
|
26.3%
|
|
 FTFY Employed
|
|
|
|
||||
Less Than 1.5x FPL
|
11.4%
|
3.1%
|
5.6%
|
7.7%
|
9.3%
|
20.1%
|
|
1.5-2.49x FPL
|
17.4%
|
7.1%
|
12.8%
|
15.2%
|
20.0%
|
26.7%
|
|
| Source: Annual Earnings Statistics from published 2007–2011 ACS information, workers by poverty status based on tabulations of 2007–2011 ACS PUMS data by authors. | |||||||
One of the limitations of the FPL is
that thresholds are not adjusted for geographic location despite the fact that the
cost of living in large urban areas, such as Los Angeles, is considerably
higher than in other regions. For this reason, the project classifies families
with less than one and a half times the FPL as being poor. Families in the
range of 1.5 times and 2.49 times the FPL are classified as being lower-income.
The percentages in the second half of table 3 are based on these definitions,
and the statistics are based on tabulations of PUMS data by the authors.
The empirical results show that nearly
one in five AIAN workers lives in a poor family, a proportion higher than all
other groups except Hispanics. Another one in five AIAN workers lives in a lower-income
family, again a rate higher than all other groups except Hispanics. In other
words, AIANs are disproportionately over-concentrated among the poor and those
with limited income. Working FTFY lowers the percentages, but does not change
the relative positions of racial/ethnic groups. AIAN FTFY workers are more
likely to be at the bottom end of the economic ladder relative to NH whites,
Asians, and Blacks.
The findings in this section show that
too many AIANs are financially struggling, working but unable to earn enough to
lift their families into the middle class. Although the consequences of lower
earnings are obvious, the causes are more difficult to determine.
Part
III: The AIAN-NHW Earnings Gap
This section of the technical memo
provides additional insights into the earnings gap between AIAN and NHW workers
reported earlier. While the observed disparity is sizable, it could be due to a
number of factors. The main objective of the analysis is to test whether being
AIAN has an adverse effect on outcomes after accounting for economic factors
that normally determine earnings. According to mainstream labor economics and
assuming a competitive labor market, human capital is the key to productivity
and compensation to labor. Human capital comes in two forms, through formal
schooling (education) and from on-the-job training (OJT, both general and firm-specific).
Markets, however, may not be perfectly competitive. For example, minorities and
women may be treated less favorably than NH white males in terms of
recruitment, screening, hiring, access to OJT, retention, and promotion. These
practices are usually seen as discrimination, which can be either overt or
subtle. The latter form is associated with unconscious prejudices, prevailing
stereotypes (which can have a statistical foundation but are generalized to all
members of a group, a phenomenon known as statistical discrimination), and
differential access to social networks. Labor markets also are also affected by
the business cycle, so outcomes vary from year to year.
The analytical challenge is to
empirically isolate the contributions of human-capital factors from other
factors. The analysis uses the following modified multivariate human-capital
model to conduct the analysis, and the model’s specification is based on the
available data, which is discussed later.
Ej =
α + β(Edj )
+ γ(Expj ) + λ(Yrj) + φ(Gj)
+σj , for workers j=1...m
Ej is the dependent (outcome) variable defined as the log of annual earnings for
worker "j". The other variables are the independent (or causal) variables,
which are hypothesized to influence the level of earnings
Edj is the number of years of schooling
Expj is the potential number of years of work experience
Yrj is a vector of dummy variables denoting the year of the survey
Gj is a vector of dummy variables denoting race-sex groups other than NH white
The
following are parameters that are statistically estimated:
α is
a constant (intersect)
β and
γ are coefficients relating schooling and experience to Ej
λ and
φ are vectors of coefficients relating years and groups to Ej
Finally, σj is the random error for observation "j", the unexplained variance not captured by the included independent variables. This model assumes that the economic returns to education and experience are the same for all groups. This assumption is relaxed in the subsequent section of the technical memo.
The data come from the 2007–2011 PUMS.
Schooling is based on the highest year of education completed. Other variables
are calculated from available information. For example, there is no reported
data on years worked; therefore, the value for the potential years of work
experience is calculated as age minus the years of schooling minus 5 years. The
empirical model also uses the square value of the potential years of experience
because the economic return to OJT declines with fewer years of work before
retirement. The vector of years is included because the ACS data are based on
responses over five years, thus labor-market outcomes were affected as the
economy entered into the "great recession." (See previous technical memo for
details on the business cycle.) The vector of groups includes NHW females, AIAN
males, and AIAN females. The excluded (reference) group is NHW males.
The subsample from PUMS includes AIAN
and NHW workers with reported earnings in the previous year who are at least 16
years old, US-born, and not currently enrolled in school. Immigrants are not
included to simplify the analysis because modeling the process of economic
assimilation is complex and beyond the scope of the project. Moreover, the
sample of AIAN immigrants is too small for any detailed analysis.
Weighted ordinary least-square regressions are used to
estimate the coefficients (α, β, γ, λ and φ) for the independent variables. The weight is the
probability of being included in the survey. A coefficient is interpreted as
the impact of increasing the value of the associated independent variable on
earnings. For example, one more year of schooling (ΔEd=1) would increase
earnings by a factor related to β. Most studies show that getting one additional year
of education increases annual earning by more than a tenth. The primary
independent variables of interest are those for groups other than being NHW
male, the reference category. If an observed inter-group difference (e.g., the
earnings gap between NHW males and AIAN males) is due just to variations in
years of schooling and experience, then the estimated value of φ should be
statistically no different than zero. This would imply that there is no
additional burden or economic cost of being AIAN in the labor market other than
the influence of differences in human capital. However, if φ is negative
and statistically significant, then the finding means that the earnings gap
between the two groups cannot be explained away because of differences in
education and experience.
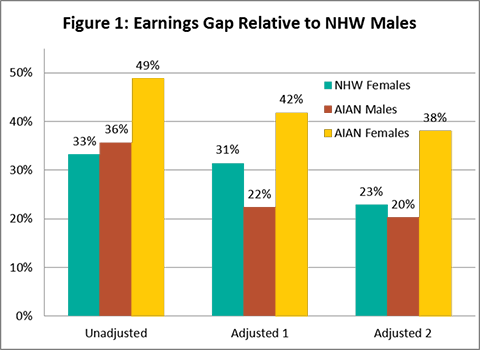
Figure 1
summarizes the key regression results, all of which are statistically
significant. The height of the bars represents the estimated earnings gap
between a group (NHW females, AIAN males, or AIAN females), and NHW males. The
first series (leftmost three bars) reports the unadjusted gaps, that is, the
differences controlling only for the year of survey but not controlling for
schooling and experience. (The estimated gaps are different than those reported
in Part II because of differences in the included populations and methodologies
to calculate the disparities.) The gaps are sizable, particularly for AIAN
females. The second set of bars (middle three) reports the gaps after
accounting for human capital factors and year of survey. The gaps do decrease,
indicating that some of the earnings gap is due to variations in education and
experience. For example, the disparity between AIAN males and NHW males drops
by more than a third. Nonetheless, there are still sizable residual differences,
indicating that nonhuman capital factors contribute significantly to disadvantaging
the three groups. AIAN males earned about 22% less, and AIAN females earned 42%
less. The final set of bars (rightmost) contains the results for an alternative
model that includes being FTFY as an additional control (independent) variable.
This modification lowers the gaps but only marginally for AIAN males and AIAN
females. Rerunning separate regressions for males and females produces similar
results in terms of the NHW-AIAN gap within each group by sex.
Estimates
by authors based on analysis of 2007–2011 ACS PUMA.
The sizable estimated impact of just
being AIAN on earnings, after accounting for human capital, indicates that AIAN
workers face enormous difficulties in making a decent income. This is commonly
interpreted as the unexplained or unjustified economic cost of being AIAN in
the labor market. As mentioned earlier, poor labor-market outcome could be
partially due to employment discrimination. The gap may also be due to
unobserved differences in the quality of schooling; that is, AIANs may have had
an inferior education for any given level of attainment relative to NHW males.
This type of inequality can be considered to be a form of pre-labor-market
discrimination or institutionalized racism. Unfortunately, ACS does not collect
information on employment discrimination or the quality of education. Despite
this data limitation, the findings nonetheless reveal that AIANs are
encountering formable hurdles that contribute to lower income for AIAN workers
and the disproportionate concentration of AIANs among the working poor.
Part
IV: Education
Improving education opportunities is one
potential strategy to improving the labor-market outcome for AIANs. AIANs have
lower educational attainment than NH whites, which is detailed below.
Simulations based on the estimated econometric model in the previous section
indicate that closing the education gap between NH whites and AIANs would cut
the earnings gap in half. While increasing schooling for AIANs is not a panacea
because there are still other employment barriers, promoting education could
nonetheless greatly improve the economic well-being of AIANs and their
families.
Table 4: Educational Attainment, 25 and
Older
|
||||||
Total
|
NH Whites
|
Asians
|
Blacks
|
AIANs
|
Hispanics
|
|
All
|
|
|
|
|
|
|
Less than High School
|
23.9%
|
6.7%
|
13.1%
|
12.6%
|
28.9%
|
45.0%
|
High School or GED
|
20.8%
|
18.2%
|
15.1%
|
24.6%
|
23.5%
|
24.4%
|
Some College or AA
|
26.0%
|
30.1%
|
22.6%
|
39.9%
|
32.2%
|
20.6%
|
BA/BS Plus
|
29.2%
|
45.0%
|
49.2%
|
22.8%
|
15.4%
|
10.0%
|
Male
|
|
|
|
|
|
|
Less than High School
|
23.8%
|
6.4%
|
10.8%
|
13.8%
|
29.2%
|
45.4%
|
High School or GED
|
21.0%
|
17.1%
|
14.5%
|
26.9%
|
23.7%
|
25.4%
|
Some College or AA
|
25.2%
|
28.9%
|
23.6%
|
37.3%
|
31.2%
|
19.9%
|
BA/BS Plus
|
29.9%
|
47.6%
|
51.1%
|
22.0%
|
16.0%
|
9.3%
|
Female:
|
|
|
|
|
|
|
Less than High School
|
24.0%
|
7.0%
|
15.0%
|
11.7%
|
28.7%
|
44.7%
|
High School or GED
|
20.7%
|
19.3%
|
15.6%
|
22.7%
|
23.2%
|
23.4%
|
Some College or AA
|
26.9%
|
31.4%
|
21.8%
|
42.1%
|
33.2%
|
21.3%
|
BA/BS Plus
|
28.5%
|
42.4%
|
47.7%
|
23.4%
|
14.9%
|
10.6%
|
| Source: 2007–2011 ACS. | ||||||
The statistics in table 4 show the
degree of disparity in educational attainment among the major racial/ethnic
groups. The figures are based on the adult population that is at least 25 years
old, including those in and outside the labor force. Hispanics have the lowest
educational attainment because of the large number of Latino immigrants who
received very limited schooling prior to entering the United States. AIANs are
more concentrated at the bottom end (those who did not complete high school)
and less likely to have a four-year college degree than the total population,
NH Whites, Asians, and Blacks. This educational disparity holds for both males
and females. Compared with NH Whites, AIANs are about four times as likely to
not have a high school degree (or its equivalent such as a GED), and only a
third as likely to have a bachelor’s degree.
Although AIANs with the same level of
education earn less than their NHW counterparts, important questions are whether
there are economic benefits to schooling among AIANs and, if so, how much. More
specifically, what is the increase in earnings from an additional year of
education for AIANs, or worded slightly differently, what is the difference in
earnings between AIANs with more education compared to those with less education?
The human-capital regression model used in the previous section assumes that
the rate of return to education is identical for everyone in the sample. More
specifically and on the average, there is, on the average, an estimated 12%
increase in earnings for every additional year of schooling. This assumption of
equal rates of return can be relaxed by estimating separate regression models
for each of the four race-sex groups (NHW males, NHW females, AIAN males, and
AIAN females), thus generating separate estimated rates of return.
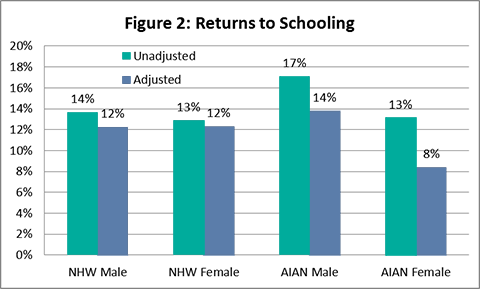
Figure 2 reports the key results from
the race/sex-specific empirical models. The gray bars report the estimated
rates of return to schooling after accounting for the year of the survey. The reported
percentages are the estimated increases in earnings from one more year of
education, and they indicate that the rates for AIANs are at least as large as
those for NH whites. The black bars report the estimated returns from models
that account for experience, survey year, and being FTFY. These additional
controls lower the estimated effects of education, but there are still
substantial benefits from schooling, particularly for AIAN males. The
noticeable drop for AIAN females is due to a strong correlation between
educational attainment and the odds of working full-time and full-year. Adjusting
for that association generates an approximate 12% rate for return for AIAN
females.
Improving educational attainment is not
sufficient to eliminating the poor labor-market outcomes for AIANs, but it is
probably a necessary element of a multi-pronged strategy. Moreover, addressing
the problem through the lens of schools enable AIANs to tackle an issue through
public policy since education is a public good. Moreover, there is broad
support for the proposition that all children should have a decent education.
Conclusion
and Recommendations:
This technical memo reports the results
from an analysis of 2007–2011 ACS data to document the labor-market status and
outcomes for American Indians and Alaska Natives in Los Angeles. The project
examines standard economic indicators and utilizes statistical techniques to
generate additional insights. The major findings are:
1.
AIANs are economically active in the labor market;
2.
AIANs have more difficulties finding jobs and working
full-time/full-year;
3.
AIANs suffer from an earning gap relative to NH Whites;
4.
Lower earnings push a disproportionate number of AIANs
into the working-poor class;
5.
Differences in the stock of human capital explain some
of the NHW-AIAN earnings gap;
6.
There is a sizable "cost of being AIAN" beyond
differences in human capital; and
7.
Closing the educational gap can ameliorate negative
labor-market outcomes.
The analytical findings point to the
following recommendations:
1.
Additional research to identify the exact nature of
the labor-market barriers facing AIANs;
2.
Greater enforcement of antidiscrimination laws to
protect AIAN workers; and
3.
Increase educational attainment opportunities for AIANs.
We would like to thank our sponsors, The California Wellness Foundation, Los Angeles County Board of Supervisor Don Knabe, and the UCLA Center for the Study of Inequality for their generous support. We would also like to thank the authors, Paul Ong and Jonathan Ong, as well as the American Indian Studies Center for supporting this project. |
[1] This technical memo is a product of a collaborative effort by UCLA American Indian Studies Center and the Los Angeles Urban Indian Roundtable. We would like to thank reviewers for their input, feedback, and comments. The authors are solely responsible for the contents of this report.
|
American Indian Studies Center 3220 Campbell Hall, Box 951548 Los Angeles, CA 90095-1548 |
Phone: (310) 825-7315 Fax: (310) 206-7060 Email: aisc@ucla.edu |
AISConnect →


|
|