Los Angeles Urban Indian Roundtable
![]() Published by the UCLA American Indian Studies Center
Published by the UCLA American Indian Studies Center
Policy Brief Number Three, August 2013
Los Angeles American Indian and Alaska Native Project
The Status of American Indians/Alaska Natives in Los Angeles: Working But Struggle1
Paul M. Ong and Jonathan D. Ong
August 23, 2013
Over the last half century, American workers have not fared well as earnings stagnant. Global competition, technological changes and weaker unions have disrupted the labor market. Minorities face the additional burden of employment discrimination and unequal access to education and training. American Indians and Alaskan Natives (AIANs) have been among the most disadvantaged. They have a harder time finding work and earn less, resulting in being disproportionately concentrated in the low-income sector.
Table 1 summarizes the labor-market status of the 16 years and older population in Los Angeles. The broadest measure of the level of economic activity is the labor-force participation rate (LFPR), the share of the population that is either employed or actively seeking a job. AIAN LRPFs are roughly comparable to those for the total population and for NHWs, and this holds regardless of sex. In other words, the data show that AIANs are economically active.
| Table 1: Labor Market Status | ||||||
Total |
NHWs |
Asians |
Blacks |
AIANs |
Hispanics |
|
Both Sexes, 16 & older |
|
|
|
|
|
|
Labor Force Participation |
65.1% |
64.5% |
62.9% |
60.7% |
64.7% |
67.2% |
Unemployment Rate |
9.8% |
8.3% |
7.5% |
14.6% |
12.0% |
10.6% |
Full-Time/Full-Year |
61.2% |
59.1% |
64.9% |
60.3% |
58.6% |
61.9% |
Male |
|
|
|
|
|
|
Labor Force Participation |
72.6% |
71.3% |
68.7% |
61.7% |
71.0% |
77.0% |
Unemployment Rate |
9.8% |
8.8% |
8.0% |
16.1% |
11.2% |
10.0% |
Full-Time/Full-Year |
66.1% |
64.6% |
69.0% |
61.0% |
63.7% |
67.3% |
Female |
|
|
|
|
|
|
Labor Force Participation |
58.0% |
57.7% |
58.0% |
59.8% |
58.2% |
57.6% |
Unemployment Rate |
9.8% |
7.8% |
7.2% |
13.1% |
12.8% |
11.5% |
Full-Time/Full-Year |
55.4% |
52.5% |
60.8% |
59.7% |
51.9% |
54.7% |
Despite being active in the labor market, AIANs have a harder time finding work. Nearly one in eight AIANs in the labor market is without a job, about one and a half times as prevalent as for NH whites.
Along with higher unemployment rates, AIANs are less likely to work full time and full year (FTFY, those who worked least 50 weeks in the previous year, averaging at least 35 hours per week). Their FTFY rate is lower than for other minorities, although there is variation by gender. The NHW rate is lower because of the relatively larger number of retired elderly.
AIANs are also disadvantaged in terms of annual earnings, as shown in Table 2. The typical (median) AIAN worker earned 58¢ for every dollar earned by the typical NHW worker, an amazing large disparity. The disparity is slightly lower among FTFY workers but still substantial, with AIANs earning 60¢ for every dollar earned by the typical NHW worker, but the AIAN-NHW gap is larger among those working less than FTFY. The AIAN-NHW earnings gap is larger among males than among females. The latter phenomenon (smaller gap among females) is due in part to the fact that NHW females earn considerably less than their male counterparts (NHW males). Nonetheless, the data indicate that AIAN females earn less because of their race and gender.
Table 2: Median earnings in the past 12 months |
||||||
Total |
NH Whites |
Asians |
Blacks |
AIANs |
Hispanics |
|
Both Sexes |
|
|
|
|
|
|
Total |
$29,348 |
$44,446 |
$36,100 |
$31,714 |
$25,797 |
$21,510 |
FTFY |
$41,334 |
$63,157 |
$48,052 |
$44,190 |
$38,000 |
$29,255 |
Not FTFY |
$12,758 |
$17,242 |
$13,918 |
$12,085 |
$11,192 |
$11,145 |
Male |
|
|
|
|
|
|
Total |
$31,972 |
$52,719 |
$39,795 |
$32,459 |
$27,446 |
$23,892 |
FTFY |
$42,377 |
$71,638 |
$50,800 |
$45,389 |
$39,180 |
$30,024 |
Not FTFY |
$14,218 |
$20,086 |
$14,973 |
$12,479 |
$11,735 |
$12,489 |
Female |
|
|
|
|
|
|
Total |
$25,920 |
$36,601 |
$32,387 |
$31,064 |
$22,343 |
$18,674 |
FTFY |
$39,399 |
$54,029 |
$44,989 |
$42,975 |
$36,321 |
$27,381 |
Not FTFY |
$11,749 |
$15,626 |
$13,077 |
$11,738 |
$10,641 |
$9,984 |
As a consequence of earning less, AIANs are more concentrated in the lower economic rungs, which can be seen in Table 3. The top half of the table reports the percent of each group falling into two low-income categories, those earning less than $10,000 and those earning between $10,000 and $19,999. Among all workers (both FTFY and non-FTFY), AIANs have the highest odds of being in the two lowest categories, with nearly one in five earning less than $10,000. In other words, AIANs are disproportionately more likely to be low-income workers, to be among the “working poor.”
An alternative measure of the economic status of workers is the economic well-being of their families relative to the federal poverty line (FPL). Nearly one in five AIAN workers lives in a poor family (those with income less than 1.5 times the FPL), a proportion higher than all other groups except Hispanics. Another one in five AIAN workers lives in a lower-income family. Working FTFY lowers the percentages, but does not change the relative positions of racial/ethnic groups. AIAN FTFY workers are more likely to be at the bottom end of the economic ladder relative to NH whites, Asians, and Blacks.
Table 3: Employed by Earnings and Poverty Categories |
||||||
Total |
NHWs |
Asians |
Blacks |
AIANs |
Hispanics |
|
By Annual Earnings |
|
|
|
|
|
|
All Employed |
|
|
|
|||
$9,999 or Less |
17.1% |
15.0% |
14.9% |
18.3% |
20.2% |
18.9% |
$10,000 to $19,999 |
18.8% |
10.8% |
13.6% |
14.6% |
19.8% |
27.2% |
FTFY Employed |
|
|
|
|||
$9,999 or Less |
2.2% |
1.5% |
1.8% |
1.9% |
3.5% |
2.8% |
$10,000 to $19,999 |
15.2% |
5.1% |
9.1% |
9.5% |
13.6% |
25.5% |
By Poverty Status |
|
|
|
|
|
|
All Employed |
|
|
|
|||
Less Than 1.5x FPL |
16.9% |
8.4% |
11.0% |
16.7% |
19.3% |
25.1% |
1.5-2.49x FPL |
18.2% |
9.3% |
14.2% |
16.7% |
22.0% |
26.3% |
FTFY Employed |
|
|
|
|||
Less Than 1.5x FPL |
11.4% |
3.1% |
5.6% |
7.7% |
9.3% |
20.1% |
1.5-2.49x FPL |
17.4% |
7.1% |
12.8% |
15.2% |
20.0% |
26.7% |
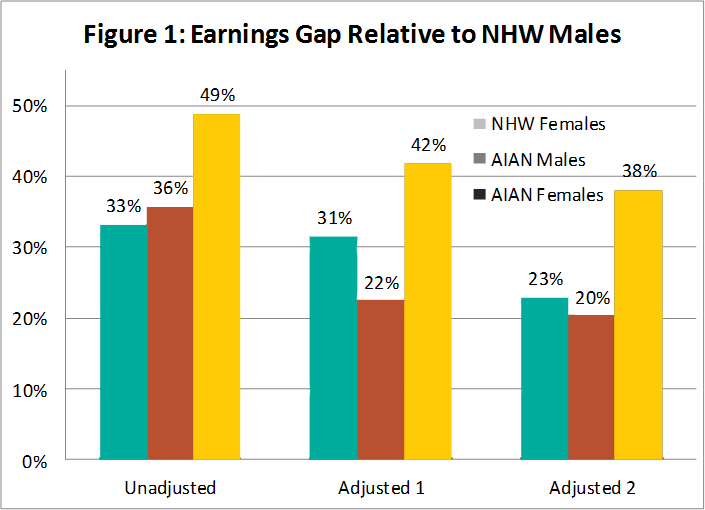
The earnings disparity is due to a number of factors, including demographic differences, variations in educational attainment and access to on-the-job training. Moreover, minorities and women are treated less favorably than NH white males in terms of recruitment, screening, hiring, retention, and promotion. Many of these practices are discriminatory, both overt and subtle. One way to decompose the earnings gap is to analyze the differences between U.S.-born AIANs and NHWs. Figure 1 summarizes the results. The left most three bars report the gaps without accounting for demographic and human-capital differences. The middle three report the gaps after accounting for human capital factors and year of survey. Comparing the two sets shows that the gaps decrease by more than a third, indicating that some of the earnings gap is due to variations in education and experience. The sizable residual differences indicate that other factors such as discrimination contribute significantly to disadvantaging AIANs. AIAN males earned about 22% less, and AIAN females earned 42% less. The final three bars contain the results for an alternative that accounts for the interaction between gender and other personal characteristics. This modification lowers the gaps but only marginally.
Improving education opportunities is one potential strategy to improving the labor-market outcome for AIANs. AIANs have lower educational attainment than NH whites, which is detailed below. Closing the education gap between NH whites and AIANs would cut the earnings gap in half. Moreover, there are substantial economic returns for each additional years of education, about 14% for AIAN males and 8% for AIAN females. Increasing schooling for AIANs is not a panacea, but promoting education should be a necessary element of a multi-pronged strategy to improve the economic well-being of AIANs and their families.
Acknowledgments
This brief was commissioned by the Los Angeles City/County Native American Indian Commission and the American Indian Community Council, and was co-developed with the Los Angeles Urban Indian Roundtable.

The Los Angeles Urban Indian Roundtable members include:
American Indian Chamber of Commerce
American Indian Community Council
American Indian Healing Center
Fernandeño Tataviam Band of Mission Indians
Los Angeles City/County Native American Indian Commission
Pukúu Cultural Community Services
Red Circle Project
Southern California Indian Center
Title VII at Los Angeles Unified School District
Torres Martinez Tribal Temporary Assistance for Needy Families
UCLA American Indian Studies Center
United American Indian Involvement
We would like to thank our sponsors, The California Wellness Foundation and Los Angeles County Board of Supervisor Don Knabe, for their generous support. We would also like to thank the authors, Paul Ong and Jonathan Ong, as well as the American Indian Studies Center for supporting this project.
1 This policy brief is a product of a collaborative effort by UCLA’s American Indian Studies Center, UCLA’s Center for the Study of Inequality, and the Los Angeles Urban Indian Roundtable. We would like to thank reviewers for their input, feedback, and comments. The authors are solely responsible for the contents of this report. For details of the analysis, see Technical Memo 3, http://www.aisc.ucla.edu/research/pb2_memo4.aspx.
|
American Indian Studies Center 3220 Campbell Hall, Box 951548 Los Angeles, CA 90095-1548 |
Phone: (310) 825-7315 Fax: (310) 206-7060 Email: aisc@ucla.edu |
AISConnect →


|
|