Los Angeles Urban Indian Roundtable
![]() Published by the UCLA American Indian Studies Center
Published by the UCLA American Indian Studies Center
Policy Brief Number One, November 2012
The Status of American Indians/Alaska Natives in Los Angeles: American Indian Population Change at the Dawn of the 21st Century
Paul M. Ong and Jonathan D. Ong
November 15, 2012
Introduction
Los Angeles County, home to more American Indians/Alaska Natives (AIANs) than any other county in the United States, is facing several challenges, many of which are discussed in this and future policy briefs.1 American Indians have been in this region well before Europeans colonized the area, although the population of the original peoples was severely diminished (MacCawley, 1996). The indigenous Tongva and Tataviam Indians of this area continue to live here, but they are not federally recognized and are largely invisible to the general public. Los Angeles is also home to AIANs who relocated from other parts of the country, many through the Bureau of Indian Affairs’ Urban Indian Relocation Program (Blackhawk, 1995, p.17; Philip, 1985, p.175). At the same time, today’s descendants of these relocated AIANs were born and raised in Los Angeles and call Los Angeles home.For AIANs alone or in combination, Los Angeles has the largest population among all counties with 140,764, followed by Maricopa County, Arizona with 107,271, and Tulsa County, Oklahoma with 60,812. For AIANs alone only, Maricopa County, Arizona has the largest population with 78,329, followed by Los Angeles with 72,828, and McKinley County, New Mexico with 53,988. Figure 1 shows the top three counties with the largest AIAN alone and in-combination population and the largest AIAN alone combination.

Source: U.S. Census 2010
This publication examines population trends of AIANs in Los Angeles County based largely on Census data, focusing on the period between 2000 and 2010.2 The analysis produces three key findings: a slowdown in population growth, an aging of the population, and an increase in the proportion of AIANs who are multiracial.
Population Trends
Los Angeles County experiences periods of rapid and slow growth. The most recent data indicates that growth has stagnated (see fig. 2).
The growth in earlier decades can be attributed to the relocation program, which started in 1952 and ended in the 1970s. Between 1960 and 1980, the AIAN population in Los Angeles grew more than fivefold. In the supsequent decade, the AIAN population declined by 5%, because the termination of the relocation program in the 1970s slowed in migration, and the recession of the 1980s forced people to leave Los Angeles for other areas.
Growth recovered in the 1990s, but it is difficult to calculate the magnitude because the U.S. Census Bureau allowed people to mark more than one race for the 2000 Census, whereas previously people could only identify as a single race. This created new statistics for AIANs alone and multiracial AIANs. Comparing the AIAN alone population to the AIAN population in the previous decade produces a low estimate of 69% growth. Using the more inclusive count with multiracial AIANs included, the AIAN count tripled.
Since the turn of the century, population growth has stagnated with only moderate increases for all AIANs alone or in combination, and decreased for AIANs alone.
There is no hard data on in- and out-migration, nor any information on what factors contributed to changes in migration patterns in the first decade of the century. We suspect that because of the difficult economic climate spurred by the Great Recession, decline in employment may lead AIANs to move away and seek employment in other parts of the country or return to Indian lands. Likewise, the lack of employment opportunities would also stem the flow of people who want to move to Los Angeles.3
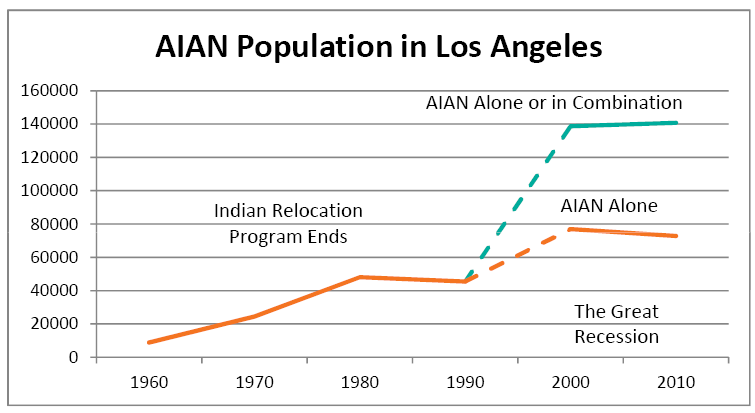
Source: U.S. Census 1960, 1970, 1980, 1990, 2000, 2010
Growth in the Multiracial Population
The proportion of AIANs who are multiracial is increasing, particularly among the young. Between 2000 and 2010, the proportion of AIANs that were multiracial increased by four percentage points from 44% to 48%. As noted above, the decrease in the absolute number of AIANs alone in conjunction with the increase in the absolute number of multiracial AIANs results in an overall slight growth in the number of AIANs.
This change has been driven by a dramatic decline in the number of single-race AIAN youths, which has dropped by a third. During this period, the number of multiracial AIANs remained stable. The drop in the number of single-race AIAN youths meant that by 2010, multiracial youths made up nearly half of AIAN youths, up from 42% in the previous decade (see table 1). Part of this may be due to an increasing number of interracial parents or changes in how people report their identity between 2000 and 2010.
Change in the Number of AIAN Adults and Youths |
|||||||||
|
All AIANs |
Single Race AIANs |
Multiracial AIAN |
||||||
2000 |
2010 |
Change |
2000 |
2010 |
Change |
2000 |
2010 |
Change |
|
Total |
138696 |
140764 |
1% |
76988 |
72828 |
-5% |
61708 |
67936 |
10% |
18 and over |
94850 |
103362 |
9% |
51708 |
53960 |
4% |
43142 |
49402 |
15% |
Under 18 |
43846 |
37402 |
-15% |
25280 |
18868 |
-25% |
18566 |
18534 |
0% |
Aging of the Population
AIANs on average have grown older; the median age for AIANs alone in Los Angeles was 28 in 2000 and 32 a decade later. There is a large decrease in the proportion of youth and a growth in the proportion of older AIANs alone, particularly those aged 40–64 and, to a lesser extent, those aged more than 65. However, the pattern differs for AIANs in combination; there is either little increase or a decrease in the proportion of each of the older age groups, but an increase in the number of youths who are multiracial AIAN. Still, this is not enough to offset the dramatic decline in youths and increase in older age groups seen for AIANs alone (see table 2).
One possible cause is because AIANs in Los Angeles are having fewer children,4 but that is difficult to establish because of the lack of complete vital statistics for Los Angeles, and a lack of detailed information on AIANs in general. Other indicators, such as school enrollment data, suggest a reversal of this pattern after 2010.5
AIAN Percentage Distribution by Age Groups |
||||||
|
All AIANs |
Single Race AIAN |
Multiracial AIAN |
|||
2000 |
2010 |
2000 |
2010 |
2000 |
2010 |
|
0-18 |
30% |
28% |
31% |
25% |
28% |
30% |
18-39 |
37% |
33% |
38% |
34% |
35% |
32% |
40-64 |
28% |
32% |
26% |
34% |
30% |
30% |
65+ |
6% |
7% |
5% |
7% |
7% |
7% |
Policy Implications
Based on the analysis of AIAN population trends and changes in composition, we make the following recommendations:
- • Enhance the ability of local agencies to effectively collect and disseminate detailed consistent and timely data on AIANs in Los Angeles. This includes better vital statistics and school enrollment. Los Angeles County should adhere to the 2006 motion by Los Angeles County Supervisor Burke, which set forth a set of comprehensive policies requiring county agencies to collect and report data on the AIAN population.
- •The Census should provide more detailed socioeconomic information on multiracial AIANs due to the increasing proportion of multiracial AIANs, and the lack of available data for socioeconomic characteristics by race for specific mixed-race populations.
- •Academic researchers and policy analysts should further examine the causes behind the population changes in the Los Angeles AIAN community. In particular, examine whether public programs and services are culturally appropriate or fail to serve AIANs.
- •Additional research should be done to understand differences in birthrate trends for LA County as compared to California state and national figures.
- •Public agencies, service providers, and educators should create and enhance programs and interventions to address AIANS, especially the relative increase of multiracial AIANs.
- •Foundations and other funders should work to strengthen the AIAN service-delivery system so that there are enhanced mechanisms for outreach to the changing AIAN population, including multiracial AIANs.
References
Blackhawk, Ned. “I Can Carry on from Here: The Relocation of American Indians to Los Angeles.” Wicazo Sa Review 11.2 (Autumn, 1995): 16–30. JSTOR. Web. 19 Oct. 2012. <http://www.jstor.org/stable/1409093>.
MacCawley, William. The First Angelinos: The Gabrielino Indians of Los Angeles. Banning: Malki Museum, 1996.
Philip, Kenneth R. “Stride toward Freedom: The Relocation of Indians to Cities, 1952–1960.” The Western Historical Quarterly 16.2 (April, 1985): 175–90. JSTOR. Web. 19 Oct. 2012. <http://www.jstor.org/stable/969660>.
Acknowledgments
This brief was commissioned by the Los Angeles City/County Native American Indian Commission and the American Indian Community Council, and was co-developed with the Los Angeles Urban Indian Roundtable.


The Los Angeles Urban Indian Roundtable members include:
American Indian Chamber of Commerce
American Indian Community Council
American Indian Healing Center
Fernandeño Tataviam Band of Mission Indians
Los Angeles City/County Native American Indian Commission
Pukúu Cultural Community Services
Red Circle Project
Southern California Indian Center
Title VII at Los Angeles Unified School District
Torres Martinez Tribal Temporary Assistance for Needy Families
UCLA American Indian Studies Center
United American Indian Involvement
We would like to thank our sponsors, The California Wellness Foundation and Los Angeles County Board of Supervisor Don Knabe, and the UCLA Center for the Study of Inequality for their generous support. We would also like to thank the authors, Paul Ong and Jonathan Ong, as well as the American Indian Studies Center for supporting this project.

1Professor Paul Ong holds joint appointments in Asian American Studies, Luskin School of Public Affairs, and Institute of the Environment and Sustainability. Jonathan Ong graduated from UCLA with a major in Japanese and minor in film studies, and has worked as a data analyst on projects related to socioeconomic inequality. For a detailed discussion of methods and data, see technical memo, Jonathan Ong and Paul Ong, “Population Change & Components of Change,” UCLA AISC, October 2012. <http://www.aisc.ucla.edu/research/pb1_memo1.asp>.
2 Census data have two potential limits: undercounts and the self-reporting methodology. Nonetheless, these are the official figures used by public agencies.
3 For further discussion of the socioeconomic status of AIANs, see technical memo “2011 Los Angeles AIAN Economic Indicator Brief” <http://www.aisc.ucla.edu/research/ pb1_memo2.asp>.
4 A possible explanation is that that urban economic constraints result in the decision of families to have fewer children.
5 This point should be viewed with caution because it may also indicate that LAUSD does not use the same methodology as the Census and that there is a lack of comparable data.
|
American Indian Studies Center 3220 Campbell Hall, Box 951548 Los Angeles, CA 90095-1548 |
Phone: (310) 825-7315 Fax: (310) 206-7060 Email: aisc@ucla.edu |
AISConnect →


|
|